![]()
![]()
![]()
![]()
![]()
![]()
[T]he ideas of economists and political philosophers, both when they are right and when they are wrong, are more powerful than is commonly understood. Indeed, the world is ruled by little else. Practical men, who believe themselves to be quite exempt from any intellectual influences, are usually the slaves of some defunct economist. Madmen in authority, who hear voices in the air, are distilling their frenzy from some academic scribbler of a few years back. I am sure that the power of vested interests is vastly exaggerated compared with the gradual encroachment of ideas. Not, indeed, immediately, but after a certain interval; for in the field of economic and political philosophy there are not many who are influenced by new theories after they are twenty-five or thirty years of age, so that the ideas which civil servants and politicians and even agitators apply to current events are not likely to be the newest. But, soon or late, it is ideas, not vested interests, which are dangerous for good or evil..
About Real-World Economics
(Last updated: 10/10/2020)
We live in a country in which many people, if not the vast majority, hold beliefs about the federal budget that are demonstrably inconsistent with the facts that exist in the real world. The extent to which this is so is easily seen by considering how many people would be surprised to discover that the size of the federal budget as a fraction of our economy—that is, as a percent of gross domestic product (GDP)—at the end of the Clinton administration was about where it was in the late 1950s and early 1960s and that leading up to the pandemic it was about where it was during the Carter administration. How many people would be shocked to discover that there were more federal government employees in 1967 (2.85 million civilians plus 3.45 million military) than there were in 2013 (2.77 million civilians plus 1.53 million military)? How many would also be shocked to discover that federal employees as a fraction of the civilian labor force has fallen by more than 50% since the 1960s? And how many know that Americans are one of the least-taxed people among the advanced countries in the world?
These are all simple and easily verifiable real-world facts that most people would find almost impossible to believe given the deluge of disingenuous, antigovernment rhetoric that is designed to encourage us to believe otherwise.
Our Exploding Federal Budget
The fact that the size of the federal budget as a fraction of our economy at the end of the Clintion administration was about where it was in the late 1950s and early 1960s and that leading up to the pandemic it was about where it was during the Carter administration is shown in Figure 1.
Figure 1: Federal Outlays as a Percent of GDP, 1930-2019.
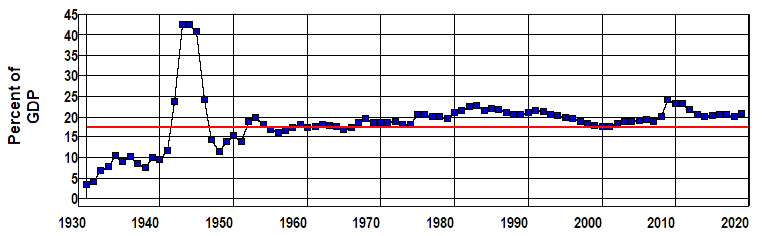
Source: Office of Management and Budget (Table 1.2 ),
This figure, which plots total federal outlays as a percent of GDP from 1930 through 2019, shows that in spite of what most people seem to believe:
![]() The most significant increases in the
federal government's role in the economy took place in the 1930s, 1940s, and 1950s.
The most significant increases in the
federal government's role in the economy took place in the 1930s, 1940s, and 1950s.
![]() Federal Outlays relative
to the size of the economy in 2019 (21.0% of GDP) were comparable to those in 1980 (21.1% of GDP).
Federal Outlays relative
to the size of the economy in 2019 (21.0% of GDP) were comparable to those in 1980 (21.1% of GDP).
![]() The average level of Federal
Outlays relative to GDP since 2000 (21.0%) was more than the average in the 1970s (19.4%) and less than it was in the
1980s (21.6%).
The average level of Federal
Outlays relative to GDP since 2000 (21.0%) was more than the average in the 1970s (19.4%) and less than it was in the
1980s (21.6%).
This is what our exploding federal budget actually looks like in the real world.
Our Ever-Growing, Out-of-Control Federal Bureaucracy
Figure 2 shows the relationship between the number of Federal Government Employees—Total, Civilian, Military, and Postal—and the Civilian Labor Force and Population of the United States from 1950 through 2014.
Figure 2: Federal Government Employees, 1950-2014.
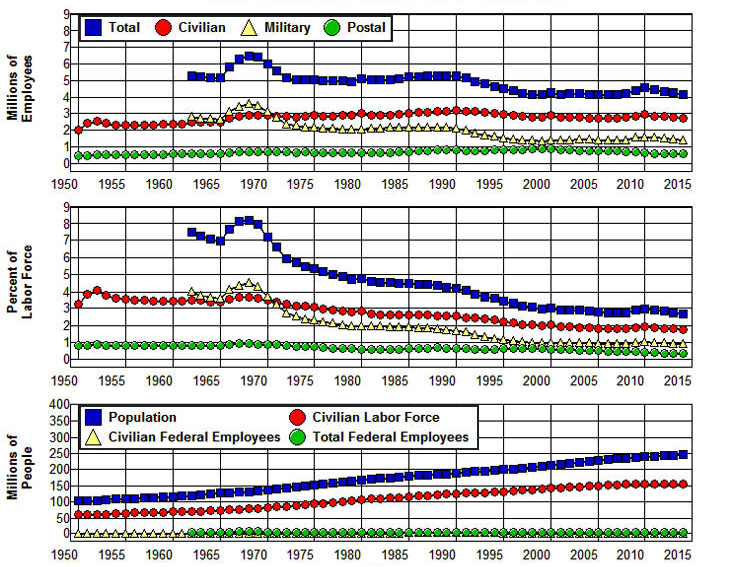
Source: Bureau of Labor Statistics (A-1 B-1), Office of Personal Management.
As is shown in this figure the Total number of Federal Government Employees (Civilian plus Military) and federal Military employees fell substantially as the Vietnam War wound down and the Cold War came to an end. At the same time, the number of Civilian federal employees has remained relatively constant since 1967 (hovering around three million) in spite of the fact that the Civilian Labor Force has doubled since 1967 and the civilian Population increased by 90%. What's more, Figure 2 clearly shows that Civilian federal employees as a fraction of the workforce has been cut in half since the 1960s and by even more when we include Military employees. Civilian federal employees were 3.7% of the labor force in 1967; they were only 1.8% of the labor force in 2014, and it is worth noting that 22% of all Civilian federal employees worked for the Post Office in 2014 and delivered our mail!
This is what our ever-growing, out-of-control federal bureaucracy actually looks like in the real world.
Our Unbearable Tax Burden
The fact that Americans are not terribly overtaxed is shown quite clearly in the following table that is constructed from the data in the CIA World Factbook.
|
National Government Taxes and Other Revenues as a Percent of GDP |
|||||||
|
United States |
17.2 |
Uganda |
15.2 |
Costa Rica |
14 |
Korea, North |
11.4 |
|
Guinea |
17 |
Sri Lanka |
15.1 |
Philippines |
13.9 |
Timor-Leste |
11 |
|
Cameroon |
16.8 |
South Sudan |
15 |
Burma |
13.8 |
Bangladesh |
10.8 |
|
New Guinea |
16.7 |
Suriname |
14.9 |
Yemen |
13.5 |
Turkmenistan |
10.6 |
|
Curacao |
16.6 |
Liechtenstein |
14.9 |
West Bank |
13.4 |
India |
10.2 |
|
Malaysia |
16.5 |
Pakistan |
14.9 |
Indonesia |
12.9 |
Afghanistan |
9.5 |
|
Taiwan |
16.3 |
Egypt |
14.7 |
Madagascar |
12.2 |
Puerto Rico |
9 |
|
Bahrain |
16.1 |
Monaco |
14.6 |
Chad |
12.1 |
Sudan |
6.9 |
|
Tanzania |
15.3 |
Benin |
14.6 |
Brunei |
12 |
Syria |
4.2 |
|
Ethiopia |
15.2 |
Isle of Man |
14.6 |
Guatemala |
11.8 |
Nigeria |
3.5 |
Source: CIA World Factbook (Country Comparison: Taxes and Other Revenues).
These are the countries of the world that devote a smaller proportion of their gross income (GDP) to their national governments than the United States. How does the quality of life in these countries compare to the quality of life in the countries of Western Europe and North America?
The following tables are constructed from the official statistics of the Organization for Economic Cooperation and Development (OECD). These tables show how the ranking of the United States among the OECD countries has changed since 1980 in terms of total government tax revenues as a percent of gross income (GDP) as well as this percentage for all OECD countries in 2016:
|
1980 |
1990 |
2000 |
2010 |
||||
|
USA |
25.5 |
Australia |
28 |
Australia |
30.4 |
Ireland |
27 |
|
Japan |
24.5 |
Portugal |
26.5 |
Latvia |
29.1 |
Japan |
26.5 |
|
Switzerland |
23.3 |
USA |
26 |
USA |
28.2 |
Switzerland |
26.5 |
|
Spain |
22 |
Greece |
25.2 |
Switzerland |
27.4 |
Australia |
25.4 |
|
Portugal |
21.9 |
Switzerland |
23.6 |
Japan |
25.8 |
Turkey |
24.8 |
|
Greece |
20.8 |
Korea |
18.8 |
Turkey |
23.6 |
USA |
23.5 |
|
Korea |
16.9 |
Chile |
16.9 |
Korea |
21.5 |
Korea |
23.4 |
|
Mexico |
14.5 |
Turkey |
14.5 |
Chile |
18.8 |
Chile |
19.6 |
|
Turkey |
13 |
Mexico |
12.4 |
Mexico |
13.1 |
Mexico |
13.4 |
|
Tax Revenues of OECD Countries as a Percent of GDP, 2016 |
|||||||
|
Denmark |
45.9 |
Greece |
38.6 |
Czech Repub |
34 |
Latvia |
30.2 |
|
France |
45.3 |
Norway |
38 |
Poland |
33.6 |
Australia |
28.2 |
|
Belgium |
44.2 |
Germany |
37.6 |
Spain |
33.5 |
Switzerland |
27.8 |
|
Finland |
44.1 |
Luxembourg |
37.1 |
United Kingdom |
33.2 |
Korea |
26.3 |
|
Sweden |
44.1 |
Slovenia |
37 |
Slovak Repub. |
32.7 |
United States |
26 |
|
Italy |
42.9 |
Iceland |
36.4 |
New Zealand |
32.1 |
Turkey |
25.5 |
|
Austria |
42.7 |
Estonia |
34.7 |
Canada |
31.7 |
Ireland |
23 |
|
Hungary |
39.4 |
Portugal |
34.4 |
Israel |
31.2 |
Chile |
20.4 |
|
Netherlands |
38.8 |
OECD - Average |
34.3 |
Japan |
30.7 |
Mexico |
17.2 |
Source: Organization for Economic Cooperation and Development, (Comparative Tables).
This is what our unbearable tax burden actually looks like in the real world. The United States ranked fifth from the bottom on this list in 2016. We collected 24% less in taxes in that year (26%) than the average for the OECD countries (34%), 35% less than the 17 countries that were above the average (40%), 39% less than the top 10 countries (43%), and these are the most prosperous and economically advanced and productive countries in the world!
Does it really make sense for the United States to be running a race to the bottom with Turkey, Ireland, Chile, and Mexico? I don't think so! The simple fact is that all of the countries that have higher life expectancies, healthier populations, lower crime and incarceration rates, better educated populations, higher standards of living, lower poverty rates, better public infrastructure, and that are able to promote the general Welfare better than the United States pay higher taxes than we do. (See the OECD Comparative tables.)
The American Fiscal Dilemma
The ideas that the federal budget and federal employment have grown voraciously over the past fifty years and that Americans are terribly overtaxed are only three of the fiscal myths people believe today. In a February 2013 survey the Pew Research Center asked 1,504 respondents: "If you were making up the budget for the federal government this year, would you increase spending, decrease spending or keep spending the same" for nineteen different categories of government expenditures. The expenditure categories and results of the survey are given in Figure 3.
Figure 3: Pew Research Center/USA Today Survey Results,
February 2013.
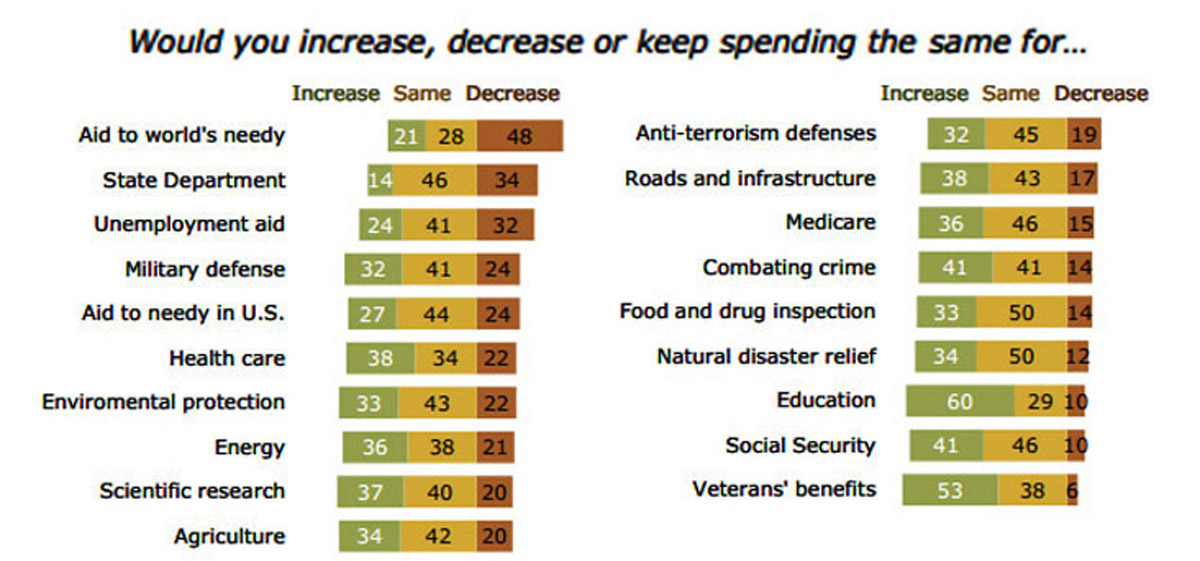
Source: Pew Research Center
For all categories of expenditures, other than the first three, a larger proportion of the respondents would choose to increase rather than decrease expenditures, and for all categories, even the first three, a majority of those who had an opinion would either increase expenditures or keep them the same. In addition, the three categories for which more respondents would rather decrease than increase—Aid to the world's needy, State Department, and Unemployment aid—sum to just 2% of the federal budget while just five of the categories which more respondents would increase rather than decrease—Social Security, Military defense, Medicare, Health care, and Aid to needy in U.S.—sum to almost 80% of the federal budget. These results suggest that the vast majority of the American public is satisfied with the size of the federal government we have, and, if anything, would like to see it increase rather than decrease.
These results stand in stark contrast with those of the Pew Research Center/USA Today survey conducted later that same month. In this survey the respondents were asked if the president and Congress should focus on spending cuts, tax increases, or both in order to reduce the federal budget deficit. The results are given in Figure 4.
Figure 4: Pew Research Center/USA Today Survey Results, February 2013.
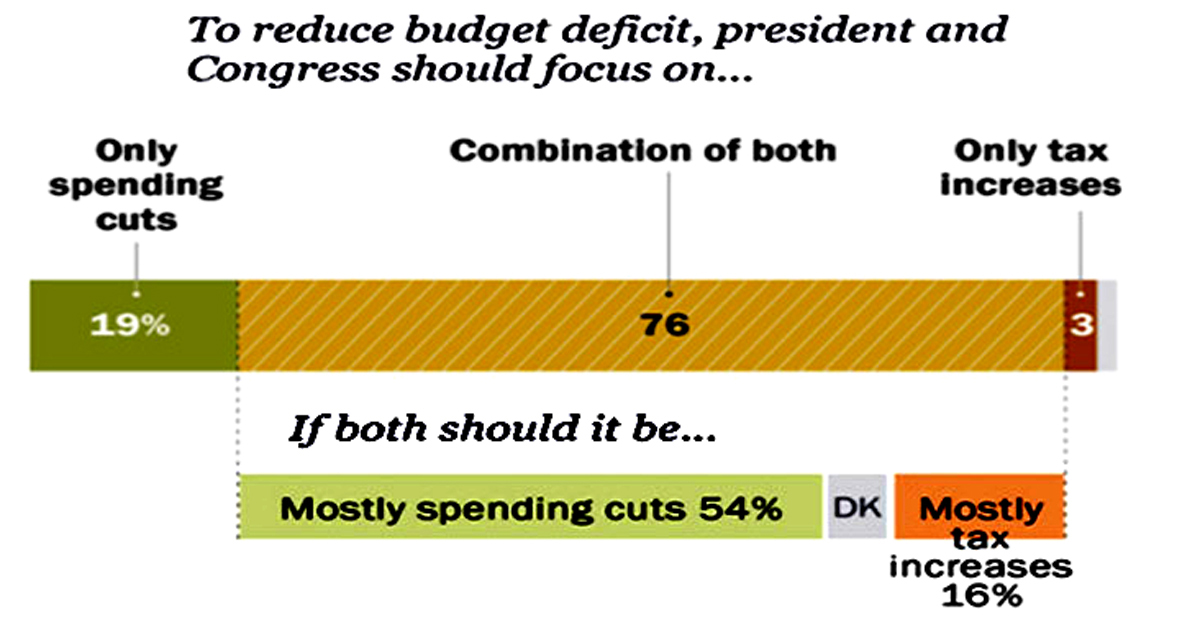
Source: Pew Research Center/USA Today
Here we find that the overwhelming majority of respondents (73%) said they would like to see the federal deficit problem solved through only (19%) or mostly (54%) spending cuts rather than through only or mostly tax increases. In other words, an overwhelming majority of the American people would like to have their cake and eat it too; they want to increase the size of the federal government or keep it the same as they solve the deficit problem through only or mostly spending cuts.
The Federal Budget in the Real World
According to the Office of Management and Budget, the federal deficit in 2019 amounted to $984.16 billion. This was equal to 21.6% of the federal budget. The following chart shows a breakdown of federal expenditures in 2019 with the 21.6% deficit hole in it.
Figure 5: United States Federal Expenditures, 2019.
Source: Office of Management and Budget (1.1, 3.2 11.3)
(Click Here for Graphs since 1960)
Even a causal examination of this chart reveals that it is impossible to maintain the government the vast majority of the American people seem to want and at the same time reduce the deficit by as much as 21.6% through mostly spending cuts:
1. Maintaining our current levels of expenditures on Social Security and Medicare (37% of the budget)—as over 80% of the respondents in the Pew poll say they would chose to do—leaves only 54.5% of the budget to cut after deducting the 8% of the budget that goes to interest on the national debt. It would require a 40% cut in the rest of the budget if we wished to balance the budget through spending cuts and exempt Social Security and Medicare from cuts.
2. Maintaining our current levels of expenditures on aid to the needy (14% of the budget, the largest program being Medicaid which is 9% of the budget) in addition to those on Social Security and Medicare—as over 80% of the respondents in the Pew poll also say they would chose to do—leaves only 31% of the budget to cut after deducting interest on the national debt. A 21.6% cut in the total budget would require a 69% cut in this 31% in order to balance the budget through spending cuts.
3. And if we were to include maintaining our current levels of defense (15% of the budget) among the other excluded categories—as over 70% of the respondents in the Pew poll say they would chose to do—it would leave only 15% of the budget to cut. A 21.6% cut in the total budget would require a 133% cut in this 15% of the budget in order to balance the budget through spending cuts which, of course, means that we can't cut spending by 21.6%% and fund Social Security, Medicare, aid to the needy, and defense.
Where are these cuts supposed to come from? From eliminating waste, fraud, and abuse? I don't think so! As I have explained in Waste, Fraud, and Abuse in the Federal Budget, the idea that we can reduce the federal budget even by 10% through eliminating waste, fraud, and abuse only makes sense to those who refused to look at the numbers or are enumerate.
The federal budget has been at the center of the political debate in our country for the past forty years, and, yet, few people seem to understand how the money is spent. As the Pew Research Center and Pew Research Center/USA Today surveys indicate, many, if not most seem to believe that somehow we can cut the budget dramatically, say by as much as 10%, and can thereby save a substantial amount in taxes without having to cut defense or Social Security or Medicare and without cutting those programs that make up our social safety net. At the same time there are those at both ends of the political spectrum who believe we can save a tremendous amount in taxes by cutting defense. (Coburn Sanders) Figure 5 clearly indicates that these beliefs are absurd. Figure 6 and Figure 7 below may help to make this point even more forcefully.
Figure 6 is constructed from OMB's Table 3.1—Outlays by Superfunction and Function. This figure plots a breakdown of the actual, real-world outlays of the federal government in terms of its three largest categories (Superfunctions) from 1940 through 2019: Defense, Human Resources, and Net Interest both as a percent of GDP and of Total Outlays.
Figure 6: Defense, Human Resources, and Net Interest, 1940-2019.
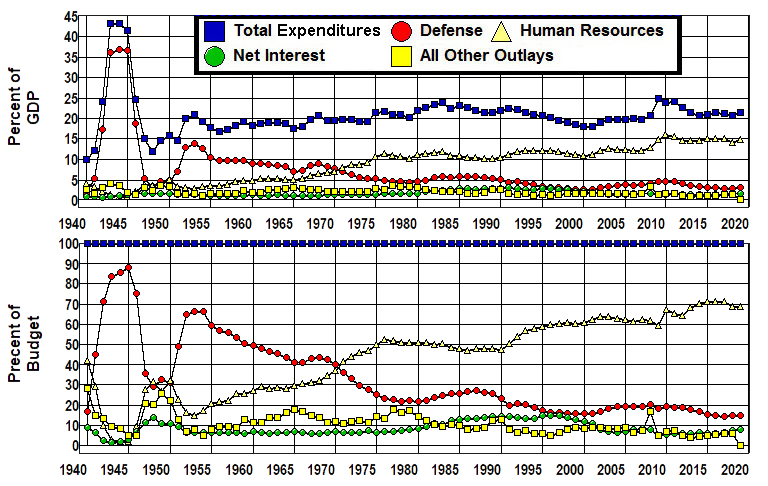
Source: Office of Management and Budget. (3.1 10.1)
The first thing we see when we look at the graphs in this figure is that even though the size of the federal budget has changed very little relative to the economy since the 1950s, the Human Resources component of the budget—those programs that make up our social insurance system including Social Security, Medicare, and the rest of our social safety net—has grown dramatically. It has gone from less than 20% of Total Outlays in the early 1950s to more than 60% in the 2000s and stood at 69% of the federal budget in 2019.
At the same time we see that Defense has decreased just as dramatically, going from over 60% of Total Outlays in the early 1950s to around 20% in the 2000s and stood at 15% in 2019. Meanwhile the third largest category in the budget, Net Interest, has gone from a high of 14% of the Total Outlays in 1948 to a low of 5% in 2009; Net Interest stood at 8% of the budget in 2019.
What is most relevant to the point at hand, however, is what has happened to All Other Outlays and Defense in this graph.
All Other Outlays
All Other Outlays shows us how much the federal government spent on everything other than Defense, Human Resources, and Net Interest. All Other Outlays consists of such things as expenditures on Energy, Natural Resources and Environment, Transportation, Community and Regional Development, International Affairs, General Science, Space, Technology, Agriculture, Administration of Justice, and General Government—basically, all of the items north of Interest on the National Debt in Figure 5 that do not involve retirement, healthcare, or other social-insurance programs. This residual has gone from a high of 28% of the budget in 1940 to a low of 5% in 1945. It stood at 8% in 2007 before the financial and economic crisis that wrought havoc with the federal budget began and stood at 6% in 2019.
It is obvious—or at least it should be obvious to anyone who looks at the actual, real-world expenditures of the federal government plotted in Figure 5, has even the faintest idea of how the world works (Amy), and who can count—that there is no reason to believe we can save a substantial amount in taxes by cutting the programs in the All Other Outlays category in Figure 6, obviously not enough to reduce the total budget by 10%. The expenditures on programs in this category have already been cut relative to the budget and GDP by more than 60% since 1980, and even if we were to eliminate all of these expenditures completely—which, of course, we can't do and still have a functioning government—we would succeed in reducing the size of the federal budget by less than 6%. It is also worth noting that, relative to the size of our economy, we have already cut the programs in this portion of the budget below where they were in the 1950s.
What do we find when we look at Defense?
Defense
As for Defense, there may be some room to maneuver if we were to realign our budget priorities away from the military threats we faced twenty-five or thirty years ago and toward those we face today. There is, however, no reason to believe we can solve all of our fiscal problems simply by cutting Defense. Defense was only 15.1% of Total Outlays in 2015 and 3.2% of GDP in 2019. Even if we were to cut Defense in half—something that virtually no one would be willing to do—it would reduce the federal budget by less than 8%.
Thus, if we are serious about saving as much as 10% of our total federal taxes, unless we are willing to make draconian cuts in Defense or the rest of the federal budget, we must look to Human Resources. That's where the money is, and it's also where Social Security and Medicare are, as well as the other social-insurance programs that make up our social safety net. The question is:
Does it really make sense in the real world to think we can save a lot of money by cutting Human Resources without cutting Social Security or Medicare and without cutting the programs that make up our social safety net?
The OMB's Table 11.3—Outlays for Payments for Individuals details the bulk of the expenditures contained in the Human Resources category of the budget. Figure 7 breaks down the items in Table 11.3 into three categories where Retirement/Disability is the sum of all federal expenditures on retirement and disability programs, Healthcare is the sum of all federal expenditures to individuals for healthcare, and Other Human Resources is the total of all government expenditures on all other Human Resources programs. (For a detailed explanation of each of these categories along with a detailed examination of programs that are included in each category see the expanded discussion of this figure in Understanding The Federal Budget.)
Figure 7: Breakdown of Human Resources, 1940-2019.
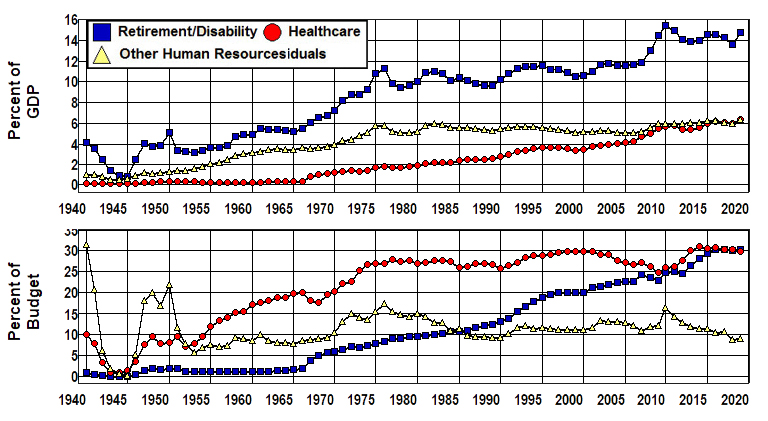
Source: Office of Management and Budget. (11.3 3.1 10.1)
The first thing we see when we look at the breakdown in Human Resources in Figure 7 is that Retirement/Disability has been the largest component of Human Resources since 1952.
The second is that while there were significant increases from 1965 through 1975 in all of the graphs in this figure, only Healthcare continued to increase after 1975. This component of the federal budget has grown almost continuously from virtually nothing in 1965 to the point where it has rivaled Retirement/Disability as the largest component of Human Resources since 2017.
Retirement/Disability and Healthcare combined dominate Human Resources and accounted for some 87% of all Human Resources expenditures in 2019. This would suggest that if we are to find ways to make substantial cuts in Human Resources we should begin by looking at Retirement/Disability and Healthcare.
The problem is that when we look at Retirement/Disability we find it is dominated by Social Security in that 76.6% of the total spent on programs in this category of the budget went to Social Security in 2019 while 19.5% went to civil service, military, and railroad retirement/disability programs, and only 1.7% to the Supplemental Security Income (SSI) program.
There is no way to make substantial cuts in this portion of the Human Resources budget without cutting Social Security. After all, military, civil servants, railroad employees, and other government employees are just as entitled to their retirement/disability benefits as are Social Security recipients, and, in any event, these programs take up only 5.8% of the total budget in 2019.
This leaves the SSI program which was 1.7% of Human Resource expenditures,1.2% of the federal budget and 0.3% of our gross income in 2019. Aside from its insignificance, SSI is the primary social safety-net program that provides for indigent disabled and indigent elderly individuals who are either not eligible for Social Security or whose benefits fall below a subsistence level. Substantial cuts in this program would not only save virtually nothing, it would also tear a huge hole in our social safety net.
What about Healthcare?
Healthcare accounted for 30% of the federal budget in 2019 where Medicare accounted for 56% of these expenditures. Medicaid (which lies at the very core of our social safety net) accounted for 30% of these expenditures, 9% of the budget, and less than 2% of our gross income in 2019. According to the Census Bureau's Table 151. Medicaid—Beneficiaries and Payments: 2000 to 2009, some 75% of its beneficiaries were either poor Children, indigent Blind/Disabled individuals, or indigent elderly adults age 65 and over, and over 85% of Medicaid's expenditures went to these individuals. In addition, Medicaid is today an essential part of the Affordable Care Act in that it makes it possible for able bodied adults who cannot otherwise afford private insurance to be to be insured. Thus, it would appear that there is very little room to cut this 9% of the budget without causing a great deal of hardship and misery through the denial of medical services to poor children or indigent disabled or elderly adults if private insurance rates are to be kept low for people with pre existing conditions.
That leaves the remaining 6% of the Human Resources budget that went to the Other Healthcare programs in 2019. Here we are talking about 4% of the federal budget and, again, less than 1% of our gross income. Of that 6%, 47% went to veterans (Hospital and medical care for veterans and Uniformed Services retiree health care fund), 9% to Children's health insurance, and 2% to Indian health, 25% to Refundable Premium Tax Credit and Cost Sharing Reductions to subsidize health insurance for low income families, 5% went to Health resources and services (a program that is designed to meet the healthcare needs in underserved, mostly rural areas), 2% went to Substance abuse and mental health services (a program that is severely under funded given the extent of the substance abuse problem in our country), and 8% (less than 0.1% of our gross income) went to medical research and other federal healthcare programs.
Veterans certainly have as much right to their medical benefits as Medicare recipients, and the rest of these programs play an important role in our social safety net. In addition, since the rest of these programs took up only 1.0% of the entire federal budget in 2019 there is virtually nothing to be saved in taxes by eliminating these programs.
The leaves but one category to examine in Figure 7: Other Human Resources.
Other Human Resources
Other Human Resources is the total of government expenditures on all Human Resources programs that are not included in the other categories in Figure 7. It is calculated by subtracting the sum of Retirement/Disability and Healthcare in Figure 7 from the total of Human Resources given in Figure 6. This category includes the expenditures on all of the federal programs in the OMB's Table 11.3 that are not medical or retirement/disability programs; it is where we find the non-healthcare/non-retirement programs that make up our social safety net.
The first thing that should be noted about this portion of the budget is that we are talking about 9% of the entire federal budget and less than 2% of our gross income in 2019. These programs comprise the backbone of our social safety net. We're talking about the Earned Income and Child Tax Credits (2% of the total budget in 2015 and less than 1% of GDP) that are designed to encourage work and assist the working poor who pay over 14% of their earned income in payroll taxes. About food stamps (SNAP), school lunch and milk programs, and feeding programs for women, infants, and children (2%/0.4%) that assist the poor in feeding themselves and their children. About student aid (1.9%/0.4%) and unemployment compensation (0.6%/0.1%). About housing assistance (0.1%/0.2%) and temporary assistance to needy families (0.4%/0.1%). About foster care and adoption assistance (0.2%/0.04). And we're talking about only 9% of the federal budget in all of the programs in Other Human Resources combined and 2% of our gross income in 2019.
There is no reason to think that we can save a great deal in taxes by making substantial cuts in this portion of the budget without dismantling our social safety net and causing a great deal of hardship and misery. The money just isn't in this 9% of the budget, and it's through the programs in this portion of the budget—combined with Medicaid and SSI—that our war against hardship and misery is waged. What's more, this portion of the budget has already been cut by 40% relative to size of the budget since 1980 and 34% relative to our gross income. (For a detailed examination of our social safety net see Chapter 4 of Understanding The Federal Budget.)
That's it! That's all there is to the entire federal budget! Everything the government spends money on in financing its ongoing operations is included in one or another of the categories contained in Figure 6 or Figure 7: Defense, Net Interest, All Other Outlays, Retirement/Disability, Healthcare, Other Human Resources. (The programs in each of these categories are examined in detail in Understanding The Federal Budget.)
What Real-World Economics is About
This is the situation that actually exists in the real world, and this is what Real-World Economics is about. It’s about cutting through the rhetoric, the spin, the propaganda, and all of the other nonsense that exists in the imaginary world many, if not most people have come to believe in, and looking at the facts as they actually exist in the real world, the world in which we actually live. It is hoped that looking at the facts in this way will introduce a degree of rationality into the otherwise hopelessly irrational debate we have been subjected to over the past forty years. After all, facts do matter, or at least they should.
Many of the papers on this website, including this introduction, have numbers in them. I realize that many people have an aversion to numbers, but I make no apology for including them here. For the past forty years we have lived in a world in which one end of the political spectrum has insisted that two plus two is six and demonized anyone who argued otherwise. Those who argued that two plus two is four have been ignored while the vast majority of the population, including our political leadership, has come to the conclusion that this sum must be five. Our nation’s economic policies have been guided accordingly with results that are totally consistent with the logic involved. This is the kind of arithmetic that got us into the mess we are in today, and it is not going to get us out. The time has come for people to look at the numbers and learn how to add.
This is particularly so when it comes to trying to understand our economic system. It is impossible to understand the economy without looking at numbers. The reason is no one can actually see the economy. The economy is made up of some 329 million people, 114 million households, 27 million business firms, 89 thousand governments, innumerable goods and services, and it is spread throughout the land and has tentacles that stretch all over the world. All we can actually experience of the economy is the very tiny part we personally interact with, and our personal experiences tell us virtually nothing about the whole.
The only way we can come to grips with the whole is to look at numbers. Output numbers. Employment numbers. Government numbers. Production numbers. Price numbers. Money supply numbers. Income numbers. International numbers. Debt numbers. Numbers! Numbers! Numbers! There are often very real problems in obtaining the numbers needed to understand the economy, and often the numbers we have don't measure what we want them to measure or think they measure, but, in the end, all we can actually know about the economic system is numbers. Everything we think we know about the economic system is just speculation unless it is supported by numbers, and everything we think we know about the economy that is contradicted by the numbers is just hot air in the absence of an explanation as to why the numbers are wrong.
In searching for ways to cut the federal budget it is important to understand that cutting a small amount from a large portion of the budget or a large amount from a small portion of the budget may yield a lot of money in absolute terms, but it doesn't yield a lot of money relative to the size of the total budget. It only reduces the total budget by a small amount. To reduce the total budget by a large amount we have to cut a large amount from a large portion of the budget. That's just grade school arithmetic.
When we look at the actual expenditures in the federal budget over the past forty years we find that it is not possible to cut a large amount from a large portion of the budget without cutting defense, Social Security, Medicare, or the programs that make up our social safety net because that's where the money is. The rest of the budget has already been cut to the bone since 1980, and there simply isn't enough money in the rest of the budget to make a difference even if we cut a large amount from this small portion of the budget.
At the same time, when we look at the actual numbers that exist in the real world we find there is no reason to believe we can reduce the size of the federal government by increasing our efforts to target specific instances of waste, fraud, and abuse, because there simply aren't enough specific instances of waste, fraud, and abuse in the budget that are of sufficient magnitude to make a difference in this regard. At best, all we can hope to do by expanding our efforts in this area is cut a small amount from a large portion of the budget, and doing this could actually cost us more to do than we can save by doing it. (See Waste, Fraud, and Abuse in the Federal Budget.) This doesn't mean we should ignore this problem. It only means that we should not expect to see a substantial reduction in the size of the budget as a result of our efforts to solve it. Those who think otherwise have a problem with arithmetic. Their numbers just don't add up in the grand scheme of things. (Cf. Coburn, Sanders, and St Luis Fed.)
It is also worth noting that attempting to address deficit problems by simply cutting the budget—which is what we have been trying to do over the past thirty years—is a recipe for disaster. When we do this we risk increasing malnutrition and death rates among poor children or indigent disabled/elderly adults and forcing people who can’t find work—for whatever reason—to become desperate which is what we can expect to happen when we simply cut the funds to those programs contained in Other Payments for Individuals in Figure 6. (Lindert) We also risk impairing the government’s ability to protect the public from poisonous food, dangerous drugs, harmful consumer products, fraud and predatory practices in our financial system, unsafe work environments, potential environmental catastrophes or to maintain our transportation systems and educate our population which is what happens when we arbitrarily cut funds to those programs contained in All Other Outlays in Figure 5. (Amy)
A fundamental, real-world truth that has been almost completely ignored in the otherwise hopelessly irrational debate we have been subjected to over the past forty years is that there are certain things that only the government can do. One is provide a system of national defense. Another is provide legal, law enforcement, and legislative systems that set and enforce the rules in a fair, efficient, and effective way. Another is provide the public education and infrastructure that makes possible such things as an educated labor force and an efficient transportation system. Yet another is to provide a social insurance system that makes possible such things as unemployment insurance, efficient healthcare and retirement systems, and a welfare system, an efficient healthcare system, all of which provide ordinary people some insurance against the devastation caused by the vagaries of our economic system. (See Amy, Lindert, and Ideology Versus Reality) Simply cutting the budget arbitrarily hinders the government's effectiveness in performing all of these functions.
It seems to me quite clear that these are all things the vast majority of the people want the government to provide. (Pew) This does not mean the vast majority of the people expect the government to take care of their every need. It means the vast majority of the people realize that, in the real world, only the government can perform these kinds of economic goods in a fair, efficient, and effective way. These are not the kinds of economic goods that can be performed fairly, efficiently, or effectively by the private sector of the economy. (Amy Lindert)
The response from those who are waging their own private war against the federal government is that we must cut the budget—especially Social Security, Medicare, and the rest of our social welfare system—because deficits and the national debt are out of control. But if we really do want to balance the budget and at the same time provide the government that the vast majority of the American people seem to want, balancing the budget through mostly tax increases makes much more sense than trying to do so through mostly spending cuts. National income in the United States amounted to $18,269 billion in 2019, and total federal outlays came to $4,546 billion. This means that the total tax liability created by a 21.6% hole in the federal budget amounted to only 5.4% of our national income. Does it really make sense to make dramatic cuts in Social Security or Medicare or to dismantle a major portion of the rest of the federal government rather than pay the extra 5.4% of our income needed to fund a government that can function?
If we want the government to provide the essential services that only government can provide we have to pay for those services, and the way we pay for them is by paying taxes. It's just that simple. (Well, not quite. There are economic crises to deal with, but since I have dealt with that in excruciating detail in Where Did All the Money Go?, I won't get into it here.)
But we live in a democracy. I don't get to decide. This is something a majority of the American people must decide, and the first thing we as a people must decide is whether we want to keep the government we have, as an overwhelming majority of the people seem to want to do, or dismantle that government in an attempt to balance the federal budget, as an equally overwhelming majority of the people also seem to want to do. We can't do both, and if we want to keep the government we have we must first accept the fact that we have to raise the taxes needed to pay for it!
Finally, I freely admit there is no reason anyone should agree with everything I have to say in the essays on this website, and constructive criticism is more than welcome. If you find a mistake, I will fix it immediately and will be ever so grateful when you point it out to me. If you can convince me I am wrong, I will change my mind. If not, we can agree to disagree. What's important is that we establish the facts as they exist in the real world, not that we agree on the interpretation or meaning of those facts.
I am convinced that it is what people "know for sure that just ain't so" that has brought us to where we are today. I also believe that if we are to find solutions to the seemingly insurmountable political, social, and economic problems we face today we must begin by leaving the imaginary world that is created by rhetoric, spin, propaganda, and all of the other nonsense and face the facts that exist in the real world, the world in which we actually live. Real-World Economics is my contribution toward the effort to make this possible.