![]()
![]()
![]()
![]()
![]()
![]()
Something to Think About
Conservatives argue that less government, lower taxes, and deregulation of the economy will lead to economic prosperity for all. The validity of this proposition can be put to the test by examining how the concentration of income
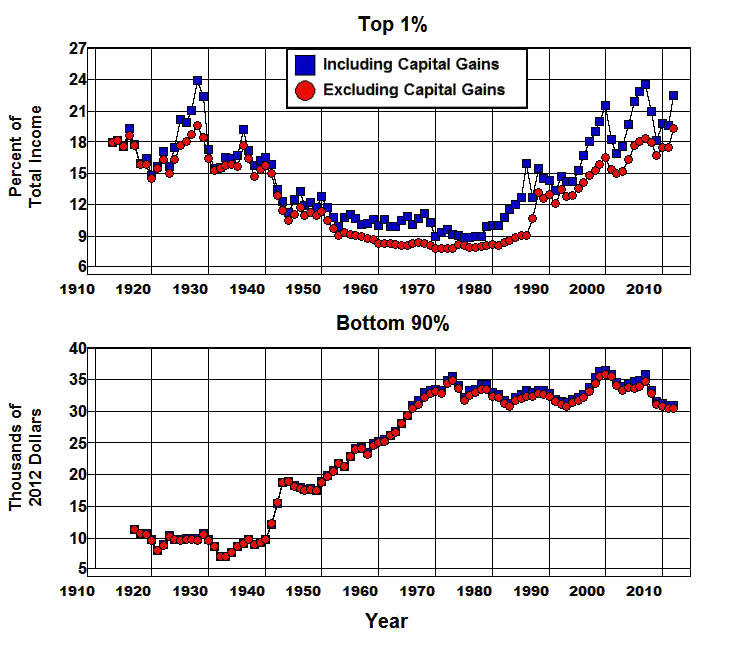
of the Top 1% of the income distribution, shown in Figure 1, and the average real income (measured in 2012 prices) of the Bottom 90% have changed within the historical context in which these changes occurred.Figure 1: Income Share of Top 1%, 1913-2012, and the
Average Real Income of Bottom 90%, 1917-2012.
Source: The World Top Incomes Database.
Turn of the Century Through the Great Depression
T
he income share of the Top 1% (excluding capital gains) in this figure averaged 16.9% of total income from 1917 through 1933 with a low of 14.5% in 1920 and a high of 19.6% in 1928. The average real income of the Bottom 90% averaged $9,447 and fell from a high of $11,291 in 1917 to a low of $6,676 in 1920 but had increased back to $10,536 by 1929. It then plummeted to $6,940 from 1929 through 1933.When we look at the historical context within which these changes took place we find that they began with World War I, followed by a rather steep recession in 1920 and 1921, a real-estate bubble from 1922 through 1926, a Stock-market bubble from 1926 through the fall of 1929, and four years of recession in which the rate of unemployment increased from 3.5% in 1929 to 24.9% in 1933.
Figure 2: Rate of Unemployment, 1929-2013.
Source: Bureau of Labor Statistics (1), Economic Report of the President, 1960 (D17).
We also find that, except during World War I, from 1917 to 1933 was an era of less government, lower taxes, and virtually no regulation, and it ended in the depths of the Great Depression at the beginning of the New Deal—that is, at the beginning of a new era in which higher taxes, more government, and more regulation became the rule.
The New Deal, World War II, and its Immediate Aftermath
The average real income of the Bottom 90% began to increase after 1933 but was essentially the same in 1940 ($9,862) as it had been in 1920 ($9,676) and was still significantly below where it stood in 1917 ($11,291). At the same time, the concentration of income
of the Top 1% averaged 15.9% from 1933 through 1940 and fell below 15% in only one year during that period. Unemployment remained above 14% throughout that period.Then came World War II as the government took over the economic system, instituted wage and price controls, rationed consumer goods, and increased personal and corporate tax rates dramatically. The result was a dramatic fall in unemployment, and the concentration of income of the Top 1% fell from 15.7% of total income in 1940 to 11.4% by 1950. At the same time there was a dramatic increase in the average real income of the Bottom 90% from $9,862 in 1940 to $18,797 in 1950.
The Prosperous Years: 1950 through 1973
Over the 23 years following 1950 we see another dramatic increase in the average real income of the Bottom 90% as it went from $18,797 in 1950 to $34,956 in 1973. At the same time, the concentration of total income of the Top 1% decreased fairly consistently throughout this period, falling from 11.4% of total income in 1950 to 7.7% in 1973.
Unlike the period leading up to 1933, this was decidedly an era of higher taxes, more government, and more regulation of the economy.
As can be seen in Figure 3, government made a relatively minor direct contribution to output in 1929, as reflected in the National Income and Product Accounts. The direct contribution of All Governments (federal, state, plus local) to GDP was less than 10% in 1929. It didn't exceed 15% until the 1933, and it remained at about that level through the remainder of the 1930s as the average real income of the Bottom 90% increased from $6,940 in 1933 to $9,862 in 1940.
Figure 3: Direct Contribution of Government to GDP, 1929-1913.
Source: Bureau of Economic Analysis (1.1.5)
In addition, taxes were exceedingly low prior to the 1930s. The maximum marginal personal income tax rate was 7% before World War I, and even though it was raised to 77% during the war it had been cut back to 25% by 1925 where it remained until 1931. The maximum corporate tax rate was 2% prior to World War I and was raised to 12% during the war where it essentially remained until 1932.
This changed in the 40 year period following the New Deal during which taxes and the direct contribution of All Governments to GDP increased dramatically as the average real income of the Bottom 90% increased fourfold, from $6,940 in 1933 to $34,956 in 1973. For the 23 year period from 1950 through 1973 the direct contribution of All Governments to GDP averaged 22.8% (compared to the 15.5% average from 1933 through 1940) as the real income of the Bottom 90% increased from $18,797 to $34,956. At the same time, the tax structure put in place during World War II was, for the most part, left in place. The top marginal personal income tax rate was 91% and the corporate rate was 52% until the 1965
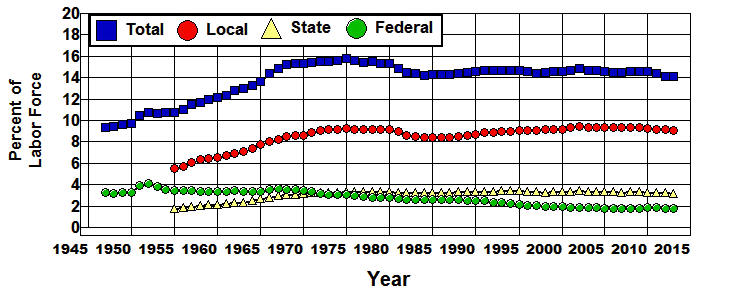
Kennedy-Johnson tax cuts reduced these rates to 70% and 48%.The increase in the direct contribution of All Governments to GDP not only represented a direct increase in output during this period, it also led to a direct increase in employment as employment by governments (excluding the military) increased from 9.8% of the labor force in 1950 to 15.5% in 1973. (Figure 4) The great bulk of this increase took the form of an increase in teachers, police officers, firefighters, public health and safety inspectors, and regulatory personnel.
Figure 4: Government Employment, 1947-2013.
Bureau of Labor Statistics, (A-1 B-1)
The increase in the direct contribution of All Governments also led to substantial increases in productivity as a result of government investments in public education and scientific research, public transportation (city streets, county roads, state and interstate highways, bridges, ports, and subway, bus, and rapid transit systems), public health, water and waste treatment facilities, and other forms of public infrastructure. In addition, government investments in our regulatory systems not only led to significant improvements in public health and safety during this period, they also kept the financial system from blowing up the economy—there were no speculative bubbles from 1933 through 1973 of the kind that lead to financial and economic crises.
It is clear from Figure 1 and Figure 2 that this era of higher taxes, more government, and more regulation from 1950 through 1973 led to low unemployment (averaging 4.8% for the entire period and exceeding 6% in only two years) and a dramatic increase the average real income of the Bottom 90% of the income distribution.
It is also clear, or at least it should be clear, that the increase in real income at the bottom was one of the most important factors that fueled the economy during this period. It was the increase in income at the bottom that caused the increase in output from 1950 through 1973, not the other way around. There is just no way all of the automobiles and refrigerators and washing machines and air conditioners and TVs and the countless other mass-produced goods and services that were produced during this period could have been sold if the income of the Bottom 90% had not increased in the way it did.
Who would have purchased all that mass-produced stuff if the concentration of income at the top and the average real income at the bottom had, instead, regressed back to their trends from 1917 through 1940 shown in Figure 1?
What would it have taken to maintain a fully employed economy if, following World War II, the concentration of income at the top and the average real income at the bottom had reverted back to their trends leading up to the war?
The answer to the later question can be found by looking back to the era that preceded World War II—the speculative bubbles of the 1920s and the secular stagnation of the 1930s—during which the concentration of income at the top remained high and the average real income at the bottom failed to rise. This was a period that ended in a decade in which the rate of unemployment never fell below 14% and in which the unemployment problem was not solved until it led us into World War II, and the government took over the economy.
The answer to the latter question can also be found by looking forward to the era that followed 1973 when the average real income at the bottom again failed to rise and the concentration of income at the top began to regain the ground it had lost since 1928.
The Great Inflation
The rate of unemployment was 5.6% in 1973. From 1974 through 1980 it averaged 6.8%, and in 1980 the actual rate of unemployment stood at 7.1%. Undoubtedly, these dismal unemployment statistics were partly caused by the episodes of tighter monetary policy that resulted from the tremulous efforts of the Federal Reserve to fight the inflation that was raging at the time, and partly by the reduction in the direct contribution of All Governments to GDP from 24.2% in 1967 to 20.6% in 1980. It is also fairly safe to say that the relentless war waged against cost push inflation during this period played a major role in determining these statistics as the average real income of the Bottom 90% fell from $34,956 in 1973 to $32,413 by 1980.
Then came the
Reagan Revolution with its mantra of lower taxes, less government, and deregulation.Reagan's Revolution
While many government programs were cut during the Reagan years, as a result of the anti-Soviet defense buildup, the direct contribution of All Governments to GDP barely budged, going from 20.6% of GDP in 1980 to 20.5% in 1988. Reagan's successes in lowering taxes (cutting the top marginal personal income and corporate tax rates from 70% and 48% in 1980 to 28% and 34% by 1988) and deregulating the economy, however, did help to lower the unemployment rate to 5.3% by the time he left office as the commercial real estate and junk bond bubbles that led to the Savings and Loan Crisis grew. But this triumph was short lived as these bubbles burst and unemployment rose to 7.5% in 1992 in the wake of the ensuing 1990 recession.
The net effect of this episode was to increase the concentration of income of the Top 1% from 8.2% in 1980 to 13.5% by 1992 as the average real income of the Bottom 90% fell from $32,413 to $31,174 during this period.
The Go-Go 1990s
Then came the 1990s in which we saw 1) rather small increases in the top marginal personal and corporate tax rates from 28.0% and 34.0% to 39.6% and 35.0%, 2) a significant cut in the direct contribution of All Governments to GDP from 20.6% of GDP to 17.8%, 3) a dramatic increase in our current account deficit from 0.7% of GDP in 1992 to 4.0% by 2000, and 4) an almost total emasculation of the regulatory systems within the federal government.
Aided by the largest stock-market bubble since the 1920s, the unemployment rate fell from 7.5% in 1992 to just 4.0% in 2000 as the average real income of the Bottom 90% increased from $31,174 to $35,799, surpassing, for the first time, the $34,956 level it had achieved in 1973. This feat was accomplished in spite of a significant increase in the concentration of income of the Top 1% from 13.5% to 16.5% of total income.
Unfortunately, when the dotcom and telecom bubbles burst and the dust had settled from the resulting
2001 recession, by 2003 the rate of unemployment had increased to 6.0% of the labor force, and the average real income of the Bottom 90% had fallen back to $33,368 and was, again, below the level it had achieved in 1973.Unregulated Finance in the 2000s
Finally, we have the aftermath of the financial deregulation of the late 1990s where the unemployment rate fell from to 6.0% in 2003 to 4.5% in 2007, and the average real income of the Bottom 90% increased somewhat during this period, from $33,368 to $34,816, slightly below the $34,956 level it had achieved in 1973.
Then in the wake of the housing bubble bursting in 2007 and the financial and economic systems melting down in 2008 the unemployment rate spiked to 9.6% of the labor force in 2010 and was still at 7.4% in 2013, six years after the recession began and in spite of a 4.2% fall in the labor force participation rate during this period.
But the real story of this era is the increase the income share of the Top 1% from 15.2% of total income in 2003 to 18.3% in 2007, falling to 16.7% in 2009 in the wake of the Housing Bubble bursting and then rebounding to 19.3% of total income by 2012—just 0.3 percentage points below the high of 19.6% it had achieved in 1928—while the average real income of the Bottom 90% fell from $34,816 in 2007 to $30,439 in 2012, a level not seen since 1967!
Summary and Conclusion
Just as it was clear from our examination of Figure 1 and Figure 2 that the end result of the era of higher taxes, more government, and more regulation was low unemployment and a dramatic increase the average real income of the Bottom 90% of the income distribution, it is just as clear from our examination of these figures that the end result of the two eras of lower taxes, less government, and deregulation was speculative bubbles, sporadic and rising unemployment, and sporadic and falling average real income for the Bottom 90% of the income distribution.
It was not unregulated free markets that brought about the increase in real incomes of ordinary people over the past 100 years. It was regulated markets within a democratic system of government that brought this into being, and the reason why this is so can be seen in Figure 5 which plots the average real income of the Top 1%, Top 5-1%, Top 10-5%, and the Bottom 90% of the income distribution from 1917 through 2012 on the same graph.
Figure 5: Summary of Average Real Income at the Top and
Bottom of the Income Distribution, 1917-2012.
Source: The World Top Incomes Database.
There's something wrong with this picture, and it is fairly easy to see exactly what's wrong with it. As John F. Kennedy pointed out, the rising tide that lifts all boats comes from a flood of rising income at the bottom of the income distribution, not from spouting geysers at the top.
For the Rest of the Story See: