Graphs from
Understanding the Federal Budget
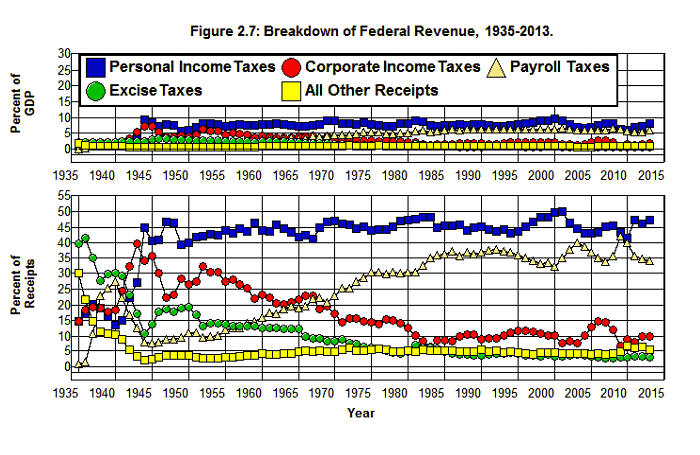
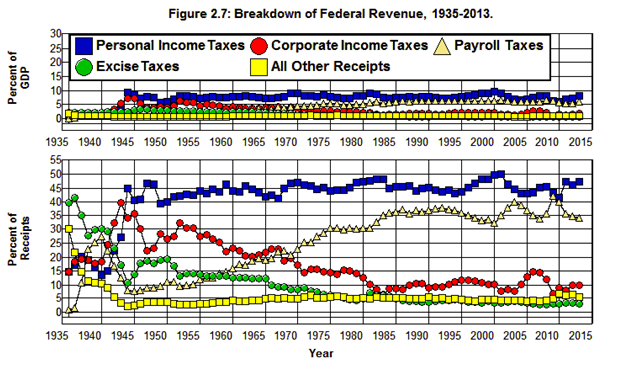
Source: Office of Management and Budget (1.1 10.1), Historical Statistics of the U.S. (Ca10).
Source: Bureau of Labor Statistics.
Source: Organization for Economic Cooperation and Development, (Comparative Tables).
Source: Pew Research Center
Source: Pew Research Center/USA Today
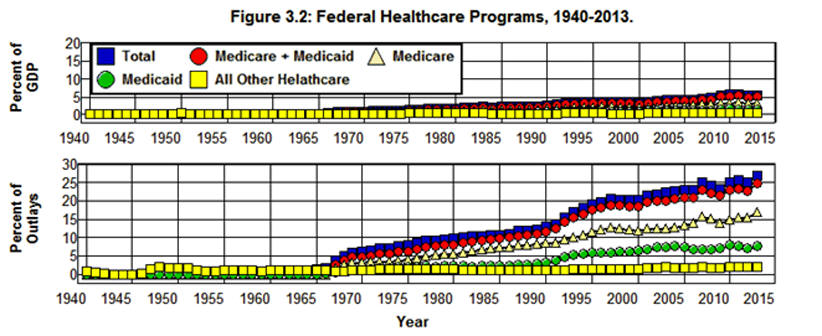
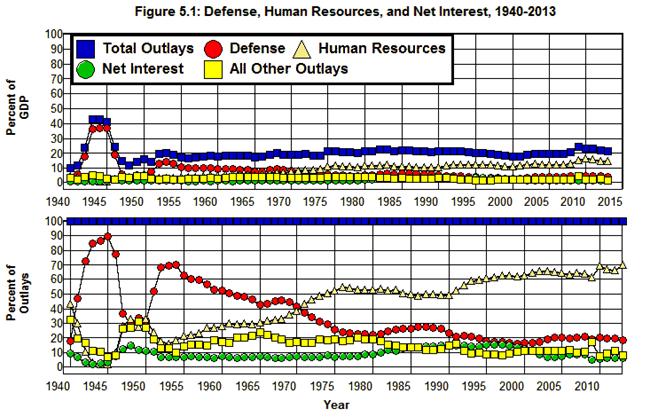
Source: Office of Management and Budget (3.2 11.3)
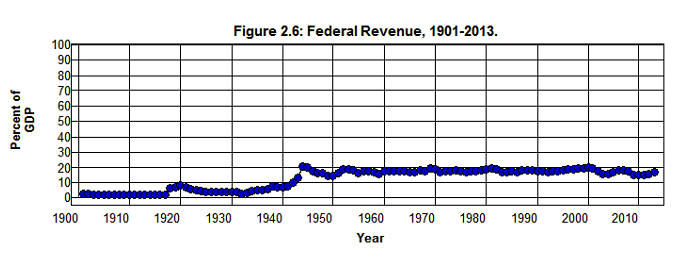
Source: Office of Management and Budget (1.1 1.2), Historical Statistics of the U.S. (Ca10)
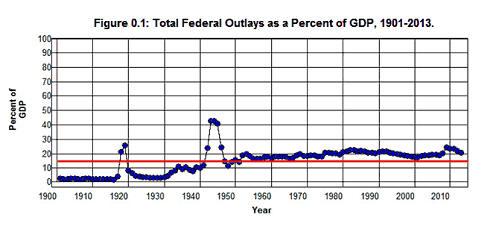
Source: Office of Management and Budget (7.1), Historical Statistics of the U.S.’s (Cj870)
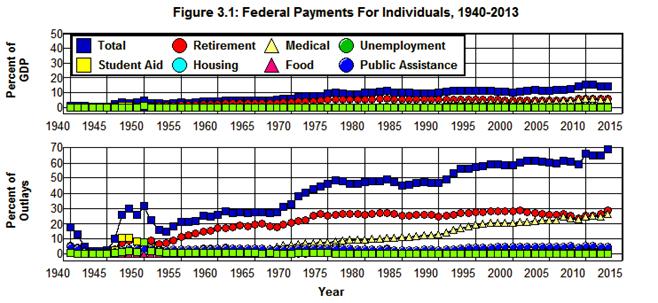
Source: Economic Report of the President, 2012 (B73PDF|XLS), Office of Management and Budget. (3.1)
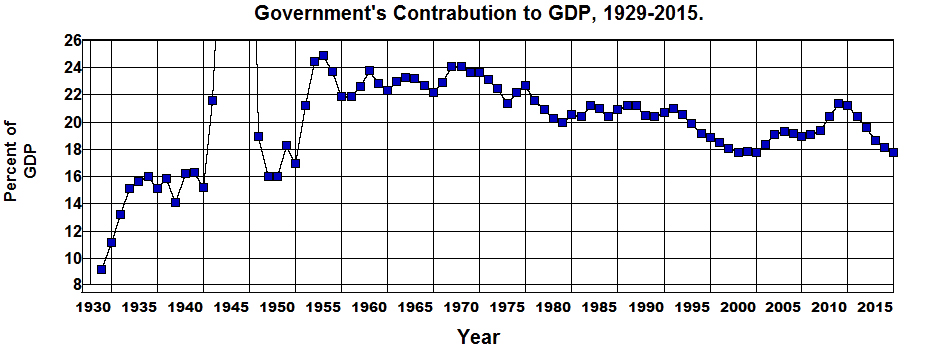
Source: Bureau of Economic Analysis. (1.1.5 1.1.6) Historical Statistics of the U.S. (Ca9, Ca10)
Source: Bureau of Economic Analysis. (1.1.5) Historical Statistics of the U.S. (Ca10)
Source: Bureau of Labor Statistics.
Source: Economic Report of the President, 2014. (B49PDF|XLS)
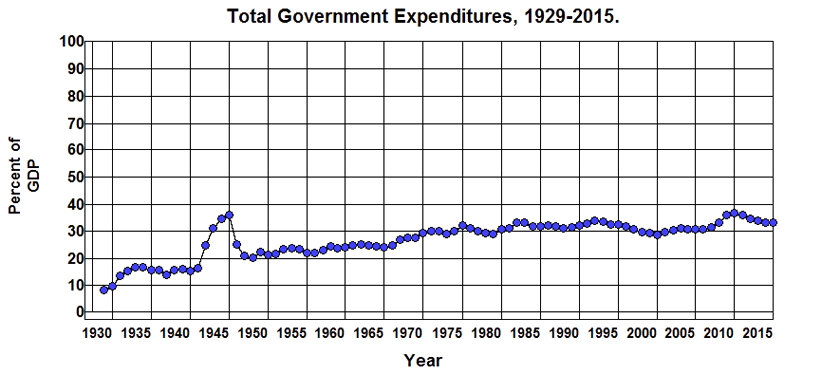
Source: Office of Management and Budget (1.1 10.1),Historical Statistics of the U.S. (Ca10)
Source: Office of Management and Budget. (3.1)
Source: Office of Management and Budget. (3.1 10.1)
Source: Office of Management and Budget. (3.1 10.1)
Source: Office of Management and Budget. (3.1 10.1)
Source: Office of Management and Budget (1.1 10.1), Bureau of Economic Analysis. (1.1.5)
Source: Office of Management and Budget. (2.3 10.1)
Source: Office of Management and Budget. (2.5 10.1)
Source: Office of Management and Budget. (3.1 2.1 10.1)
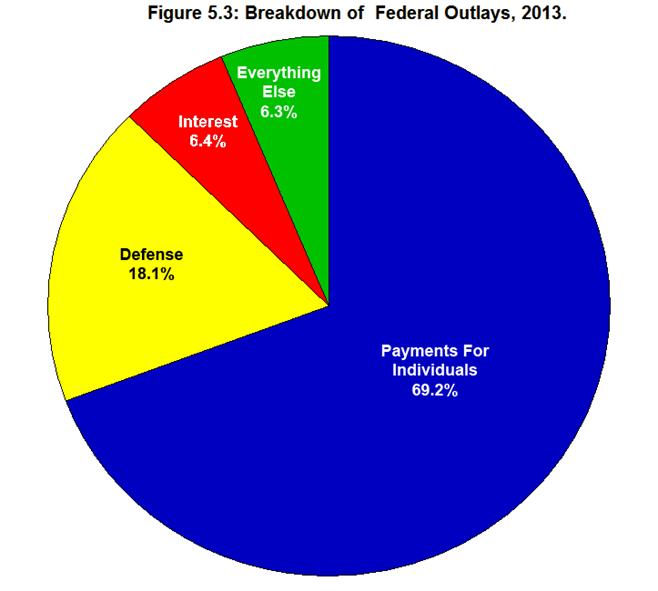
Table 2.1: Breakdown of Federal Budget by Function and Subfunction, 2013.
Function and Subfunction, 2013
Billions of
DollarsPercent of
GDPPercent of
Budget050 National Defense:
$633.4
3.81%
18.33%
051 Department of Defense-Military:
$607.8
3.66%
17.59%
Military Personnel
$150.8
0.91%
4.37%
Operation and Maintenance
$259.7
1.56%
7.52%
Procurement
$114.9
0.69%
3.33%
Research, Development, Test, and Evaluation
$66.9
0.40%
1.94%
Military Construction
$12.3
0.07%
0.36%
Family Housing
$1.8
0.01%
0.05%
Other
$1.4
0.01%
0.04%
053 Atomic energy defense activities
$17.6
0.11%
0.51%
054 Defense-related activities:
$8.0
0.05%
0.23%
150 International Affairs:
$46.4
0.28%
1.34%
151 International development and humanitarian assistance
$22.8
0.14%
0.66%
152 International security assistance
$9.9
0.06%
0.29%
153 Conduct of foreign affairs
$13.0
0.08%
0.38%
154 Foreign information and exchange activities
$1.5
0.01%
0.04%
155 International financial programs
-$0.8
-0.01%
-0.02%
250 General Science, Space, and Technology:
$28.9
0.17%
0.84%
251 General science and basic research
$12.5
0.08%
0.36%
252 Space flight, research, and supporting activities
$16.4
0.10%
0.48%
270 Energy:
$11.0
0.00%
0.00%
271 Energy supply
$9.0
0.05%
0.26%
272 Energy conservation
$1.2
0.01%
0.04%
274 Emergency energy preparedness
$0.2
0.00%
0.01%
276 Energy information, policy, and regulation
$0.5
0.00%
0.02%
300 Natural Resources and Environment:
$38.1
0.23%
1.10%
301 Water resources
$7.7
0.05%
0.22%
302 Conservation and land management
$10.7
0.06%
0.31%
303 Recreational resources
$3.5
0.02%
0.10%
304 Pollution control and abatement
$9.6
0.06%
0.28%
306 Other natural resources
$6.6
0.04%
0.19%
350 Agriculture:
$29.5
0.18%
0.85%
351 Farm income stabilization
$25.0
0.15%
0.73%
352 Agricultural research and services
$4.4
0.03%
0.13%
370 Commerce and Housing Credit:
-$83.2
-0.50%
-2.41%
371 Mortgage credit
-$87.9
-0.53%
-2.54%
372 Postal service
-$1.8
-0.01%
-0.05%
373 Deposit insurance
$4.3
0.03%
0.12%
376 Other advancement of commerce
$2.2
0.01%
0.06%
400 Transportation:
$91.7
0.55%
2.65%
401 Ground transportation
$60.0
0.36%
1.74%
402 Air transportation
$21.5
0.13%
0.62%
403 Water transportation
$9.8
0.06%
0.28%
407 Other transportation
$0.4
0.00%
0.01%
450 Community and Regional Development:
$32.3
0.19%
0.94%
451 Community development
$7.8
0.05%
0.23%
452 Area and regional development
$1.5
0.01%
0.04%
453 Disaster relief and insurance
$23.0
0.14%
0.67%
500 Education, Training, Employment, and Social Services:
$72.8
0.44%
2.11%
501 Elementary, secondary, and vocational education
$42.4
0.26%
1.23%
502 Higher education
-$0.5
0.00%
-0.02%
503 Research and general education aids
$3.7
0.02%
0.11%
504 Training and employment
$7.3
0.04%
0.21%
505 Other labor services
$1.9
0.01%
0.05%
506 Social services
$18.1
0.11%
0.52%
550 Health:
$358.3
2.16%
10.37%
551 Health care services
$321.8
1.94%
9.32%
552 Health research and training
$32.9
0.20%
0.95%
554 Consumer and occupational health and safety
$3.6
0.02%
0.10%
570 Medicare:
$497.8
3.00%
14.41%
600 Income Security:
$536.5
3.23%
15.53%
601 General retirement and disability insurance (excluding social security)
$7.0
0.04%
0.20%
602 Federal employee retirement and disability
$131.7
0.79%
3.81%
603 Unemployment compensation
$70.7
0.43%
2.05%
604 Housing assistance
$46.7
0.28%
1.35%
605 Food and nutrition assistance
$109.7
0.66%
3.18%
609 Other income security
$170.7
1.03%
4.94%
650 Social Security:
$813.6
4.90%
23.55%
700 Veterans Benefits and Services:
$138.9
0.84%
4.02%
701 Income security for veterans
$65.9
0.40%
1.91%
702 Veterans education, training, and rehabilitation
$12.9
0.08%
0.37%
703 Hospital and medical care for veterans
$52.5
0.32%
1.52%
704 Veterans housing
$1.3
0.01%
0.04%
705 Other veterans benefits and services
$6.3
0.04%
0.18%
750 Administration of Justice:
$52.6
0.32%
1.52%
751 Federal law enforcement activities
$27.3
0.16%
0.79%
752 Federal litigative and judicial activities
$14.6
0.09%
0.42%
753 Federal correctional activities
$6.9
0.04%
0.20%
754 Criminal justice assistance
$3.8
0.02%
0.11%
800 General Government:
$27.8
0.17%
0.80%
801 Legislative functions
$3.7
0.02%
0.11%
802 Executive direction and management
$0.5
0.00%
0.01%
803 Central fiscal operations
$12.1
0.07%
0.35%
805 Central personnel management
$0.4
0.00%
0.01%
806 General purpose fiscal assistance
$7.9
0.05%
0.23%
808 Other general government
$6.0
0.04%
0.17%
809 Deductions for offsetting receipts
-$2.7
-0.02%
-0.08%
900 Net Interest:
$220.9
1.33%
6.39%
950 Undistributed Offsetting Receipts:
-$92.8
-0.56%
-2.69%
Total outlays
$3,454.6
20.79%
100.00%
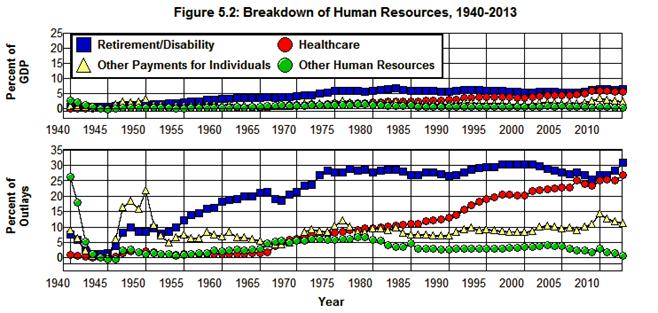
Source: Office of Management and Budget (3.2 10.1)
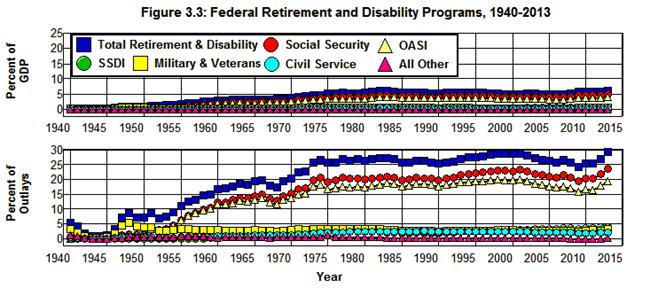
Source: Office of Management and Budget. (11.3 3.2 10.1)
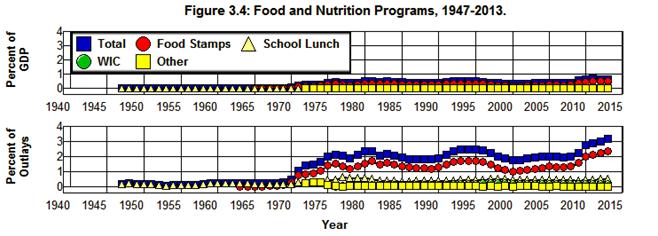
Source: Office of Management and Budget. (11.3 3.2 10.1)
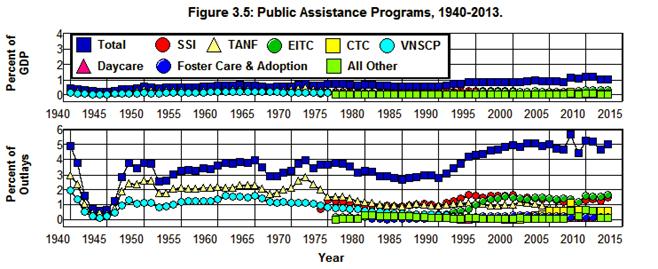
Source: Office of Management and Budget. (11.3 3.2 10.1)
Source: Office of Management and Budget. (11.3 3.2 10.1)
Source: Office of Management and Budget. (11.3 3.2 10.1)
Source: Office of Management and Budget. (11.3 3.2 10.1)
Source: Office of Management and Budget. (11.3 3.2 10.1)
Source: Office of Management and Budget. (11.3 3.2 10.1)
Table 4.1: Federal Welfare Programs and Expenditures, 2013.
Program (2013)
Billions of
DollarsPercent of
GDPPercent of
Budget$282.4
1.70%
8.17%
$9.5
0.06%
0.27%
$265.4
1.60%
7.68%
$4.3
0.03%
0.12%
$3.2
0.02%
0.09%
$44.9
0.27%
1.30%
$39.3
0.24%
1.14%
$109.6
0.66%
3.17%
$82.5
0.50%
2.39%
$19.3
0.12%
0.56%
$6.6
0.04%
0.19%
$1.1
0.01%
0.03%
$172.5
1.04%
4.99%
$50.3
0.30%
1.46%
$21.2
0.13%
0.61%
$3.5
0.02%
0.10%
$57.5
0.35%
1.66%
$5.0
0.03%
0.15%
$5.2
0.03%
0.15%
$6.8
0.04%
0.20%
$21.6
0.13%
0.63%
$0.2
0.00%
0.00%
$1.2
0.01%
0.04%
$648.6
3.90%
18.78%
Source: Office of Management and Budget. (11.3 10.1)
Source: Office of Management and Budget. (11.3 3.2 10.1)
Source: Office of Management and Budget. (11.3 3.2 10.1)
Source: Office of Management and Budget. (11.3 3.2 10.1)
Source: Office of Management and Budget. (11.3 3.2 10.1)
Source: Census Bureau (151)
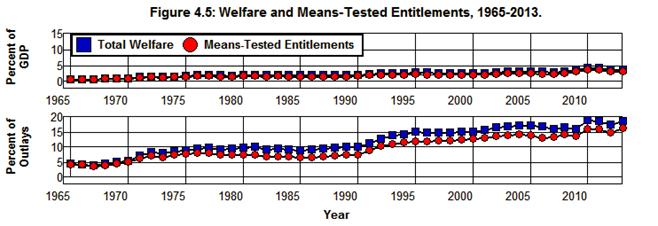
Source: Office of Management and Budget. (8.1 10.1 11.3)
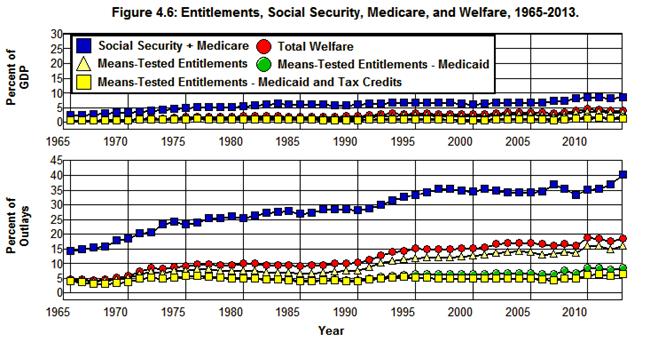
Source: Office of Management and Budget. (8.1 11.3 10.1)
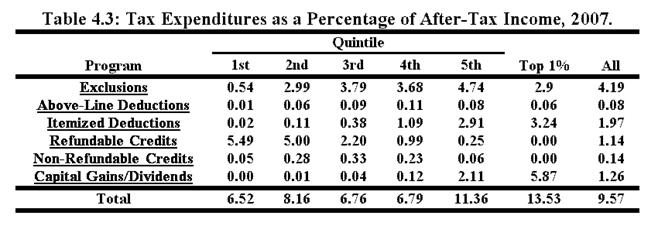
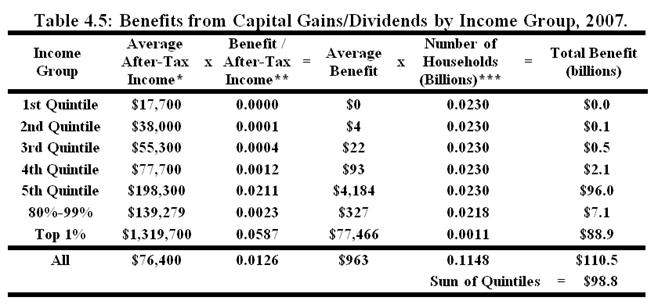
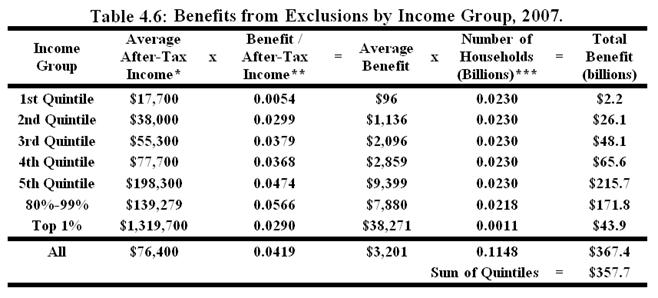
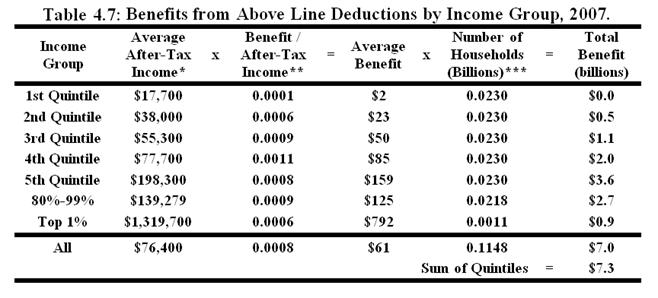
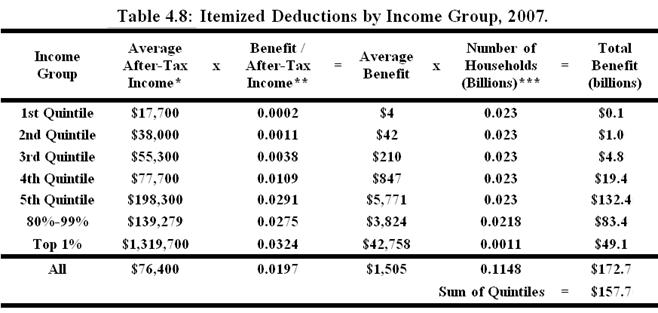
Source: Burman, Toder, and Geissler.
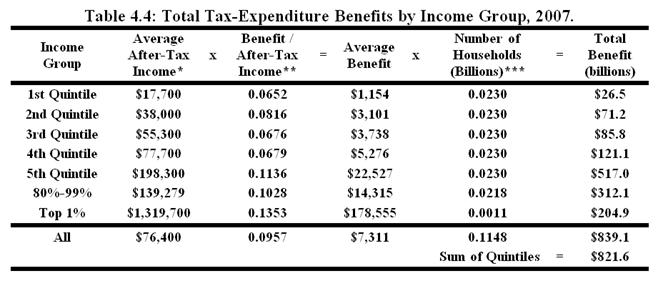
Source: *Congressional Budget Office, **Burman et al., ***Census Bureau.
Source: *Congressional Budget Office, **Burman et al., ***Census Bureau.
Source: *Congressional Budget Office, **Burman et al., ***Census Bureau.
Source: *Congressional Budget Office, **Burman et al., ***Census Bureau.
Source: *Congressional Budget Office, **Burman et al., ***Census Bureau.
Source: Office of Management and Budget. (3.1 10.1)
Source: Office of Management and Budget. (11.3 3.1 10.1)
Table 5.1: Expenditures Included in Retirement/Disability, 2013.
Program (2013)
Billions of
DollarsPercent of
GDPPercent of
OutlaysSocial security and railroad retirement: $814.5
4.90%
23.58%
Social security: old age and survivors insurance $667.2
4.01%
19.31%
Social security: disability insurance $140.1
0.84%
4.06%
Railroad retirement (excl. social security) $7.2
0.04%
0.21%
Federal employees retirement and insurance: $194.0
1.17%
5.62%
Military retirement $54.3
0.33%
1.57%
Civil service retirement $77.2
0.46%
2.23%
Veterans service-connected compensation $59.4
0.36%
1.72%
Other $3.2
0.02%
0.09%
Public assistance and related programs: $55.5
0.33%
1.61%
Supplemental security income program $50.3
0.30%
1.46%
Veterans non-service connected pensions $5.2
0.03%
0.15%
Total: Retirement/ Disability
$1,064.0
6.40%
30.80%
Source: Office of Management and Budget. (11.3 3.1 10.1)
Table 5.2: Expenditures Included in Healthcare, 2013.
Program 2013
Billions of
DollarsPercent of
GDPPercent of
Budget$583.8
3.51%
16.90%
$273.0
1.64%
7.90%
$310.8
1.87%
9.00%
$265.4
1.60%
7.68%
$9.5
0.06%
0.27%
$51.8
0.31%
1.50%
$43.6
0.26%
1.26%
$8.2
0.05%
0.24%
$15.6
0.09%
0.45%
$4.3
0.03%
0.12%
$7.3
0.04%
0.21%
$3.2
0.02%
0.09%
$0.8
0.00%
0.02%
Total: Medical care
$926.1
5.57%
26.81%
Source: Office of Management and Budget. (11.3 3.1 10.1)
Table 5.3: Non-Medical and Non-Retirement/Disability Programs, 2013.
Program 2013
Billions of
DollarsPercent of
GDPPercent of
Budget68.3
0.41%
1.98%
58.0
0.35%
1.68%
13.2
0.08%
0.38%
44.9
0.27%
1.30%
39.3
0.24%
1.14%
109.6
0.66%
3.17%
82.5
0.50%
2.39%
19.3
0.12%
0.56%
6.6
0.04%
0.19%
1.1
0.01%
0.03%
116.9
0.70%
3.38%
21.2
0.13%
0.61%
3.5
0.02%
0.10%
57.5
0.35%
1.66%
5.0
0.03%
0.15%
6.8
0.04%
0.20%
21.6
0.13%
0.63%
1.2
0.01%
0.04%
6.1
0.04%
0.18%
0.4
0.00%
0.01%
1.2
0.01%
0.04%
1.4
0.01%
0.04%
1.2
0.01%
0.04%
1.8
0.01%
0.05%
Total: Non- Medical/ Retirement/ Disability Programs
398.2
2.40%
11.53%
Source: Office of Management and Budget. (11.3 3.1 10.1)
Table 5.4: Ten Largest Items in Other Payments for Individuals, 2013.
Program 2013
Billions of
DollarsPercent of
GDPPercent of
Budget$82.5
0.50%
2.39%
Unemployment Assistance $68.3
0.41%
1.98%
$57.5
0.35%
1.66%
$44.9
0.27%
1.30%
$39.3
0.24%
1.14%
$21.6
0.13%
0.63%
$21.2
0.13%
0.61%
$19.3
0.12%
0.56%
$13.2
0.08%
0.38%
$6.8
0.04%
0.20%
Total: 10 Largest in Other Payments for Individuals
$374.6
2.25%
10.84%
Source: Office of Management and Budget’s (11.3 3.2 10.1)
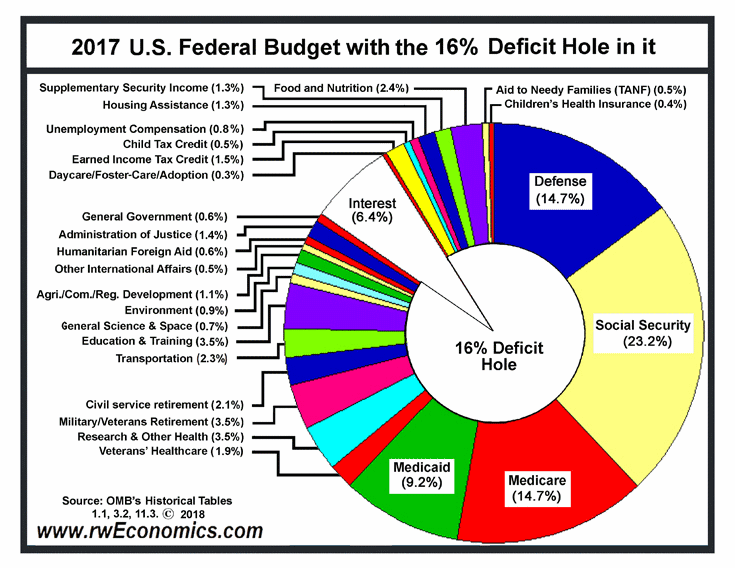
From www.rwEconomics.com:
Source: Office of Management and Budget (3.2 11.3)
See Also:
How a Conservative Would Balance the Federal Budget
Lower Taxes, less Government, and Deregulation
A Note on Tax-Expenditure Entitlements and Welfare
Budget Projections, Federal Debt, Social Security, and Medicare