![]()
![]()
![]()
![]()
![]()
![]()
Understanding the Federal Budget
Chapter 2: History of the Federal Budget
This eBook is available at Amazon.com for a $2.99 contribution to this website.
It is very difficult, if not impossible, to understand the federal budget without examining how our country has changed since 1929. The Crash of 1929, the economic catastrophe of the Great Depression, the devastation of World War II and the Cold War that followed had profound effects on the American psyche. We are not the same country we were in the 1920s, and this is particularly so when it comes to how we view government. (Kennedy Burns)
Prior to 1929, most of our political leaders, and much of the American public, had an unbridled faith in the magical powers of Free-Market Capitalism.[16] The catastrophe of the Great Depression shook that faith and changed us from a country that saw the primary role of government as serving the needs of the plutocracy to a country that sees the primary role of government as serving the needs of ordinary people. This led to the federal government sponsoring social-insurance programs such as Social Security, Medicare, Medicaid, Unemployment Compensation, Aid to Dependent Children, and Supplemental Security Income that did not exist at the federal level before the Great Depression.[17]
In addition, before World War II we were an isolationist country, reluctant to intervene in the domestic affairs of other countries except, of course, in Latin America. The devastation of World War II combined with the Cold War that followed shook our faith in isolationism and changed us from an isolationist country focused on Latin America into one willing to intervene in the domestic affairs of countries throughout the world. This led to a tremendous emphasis on national defense following World War II and to a peacetime military far beyond anything we had experienced previously. (Kennedy)
These two factors—the loss of faith in Free-Market Capitalism brought on by the Great Depression and our national interventionist policies brought on by World War II and the Cold War—have had profound effects on the nature of our federal government, and, in particular, on the size of its budget.
Government Expenditures
The dramatic effect the Great Depression, World War II and the Cold War on the size of the federal budget can be seen in Figure 2.1 which plots total Federal Outlays as a percent of GDP from 1901 through 2013.
Source: Office of Management and Budget (1.1 10.1),Historical Statistics of the U.S. (Ca10)
Federal Outlays were less than 1% of GDP before World War I and 3.1% of GDP in 1929. Then came the Great Depression of the 1930s. By 1941 Federal Outlays had increased to 11.7% of GDP. Next came the dramatic increases in government outlays from 1942 through 1945 as a result of World War II. Following the war Federal Outlays fell to 11.3% of GDP by 1948, but this was still more than three times the size of the federal government relative to the economy that existed in 1929.
The Cold War began in earnest on June 27, 1948 when the Soviet Union cut all surface traffic to West Berlin. By the time the Korean War ended in 1953 Federal Outlays had increased to 19.9% of GDP—a 75% increase over 1948—and the federal government was never to see its prewar lows again.
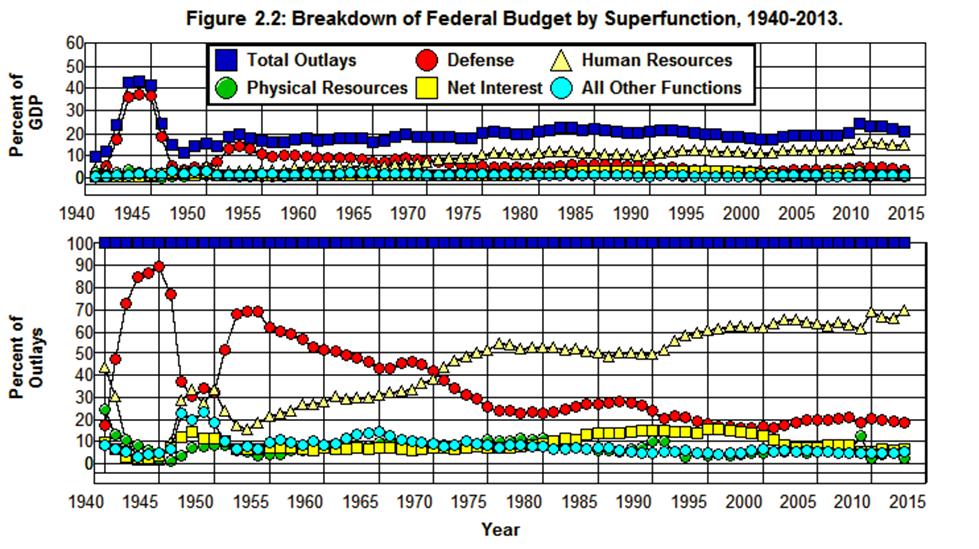
Figure 2.2 shows a breakdown of the federal budget by Superfunction from 1940 through 2013.
Source: Office of Management and Budget. (3.1)
It is clear from this figure that the increase in Defense due to the change in our interventionist policies following World War II was not the only factor that determined the increase in the federal budget following the war. The rise in social-insurance programs (Human Resources) played a major role as well. It is also clear from this figure that the other major categories of the budget have played a rather insignificant role in size of the federal budget since World War II.
Defense
The importance of Defense in increasing the size of the federal government after World War II is clearly indicated in Figure 2.2. Defense stood at 17.5% of the budget and 1.7% of GDP in 1940. After reaching 89% of the budget and 37% of GDP% during the war it had fallen back to 30.6% of the budget and 3.5% of GDP by 1948. By the end of the Korean War expenditures on Defense were back up to 69.4% of the budget and 13.8% of GDP. Defense then gradually declined to 18.3% of the budget and 3.8% of GDP by 2013 with brief interruptions in this decline in the late 1960s and early to mid 1980s due to the escalation of the Vietnam War and Reagan’s anti-Soviet defense buildup.
Thus, while dominating the federal budget in the early post World War II years, the importance of Defense has declined dramatically over the past 60 years both as a percent of GDP and of the federal budget. As a result, this component of the budget shares relatively little responsibility for the 17.7% of GDP increase in Federal Outlays in Figure 2.1 since 1929—as little as 1% or 2% of GDP or 5% or 10% of the total increase. But as defense expenditures declined over the past 60 years, the social-insurance programs that grew out of the New Deal expanded. This tradeoff is quite obvious in Figure 2.2 as indicated by the dramatic decrease in the Defense component of the budget and the dramatic increase in the Human Resources component in this figure.
Human Resources
The role that Human Resources played in increasing the size of the federal government after World War II is clearly indicated in Figure 2.2. Human Resources went from 43.7% of the budget and 4.2% of GDP in 1940 to 2% of the budget and 0.8% of GDP by 1945. After rebounding to 33.4% of the budget and 5.1% of GDP% by 1950, it had fallen back to 15.6% of the budget and 3.1% of GDP by 1953. Human Resources then increased until 1976, decreased somewhat from 1976 through 1990, and then began to increase again reaching its high of 70.0% of the budget and 14.5% of GDP in 2013.
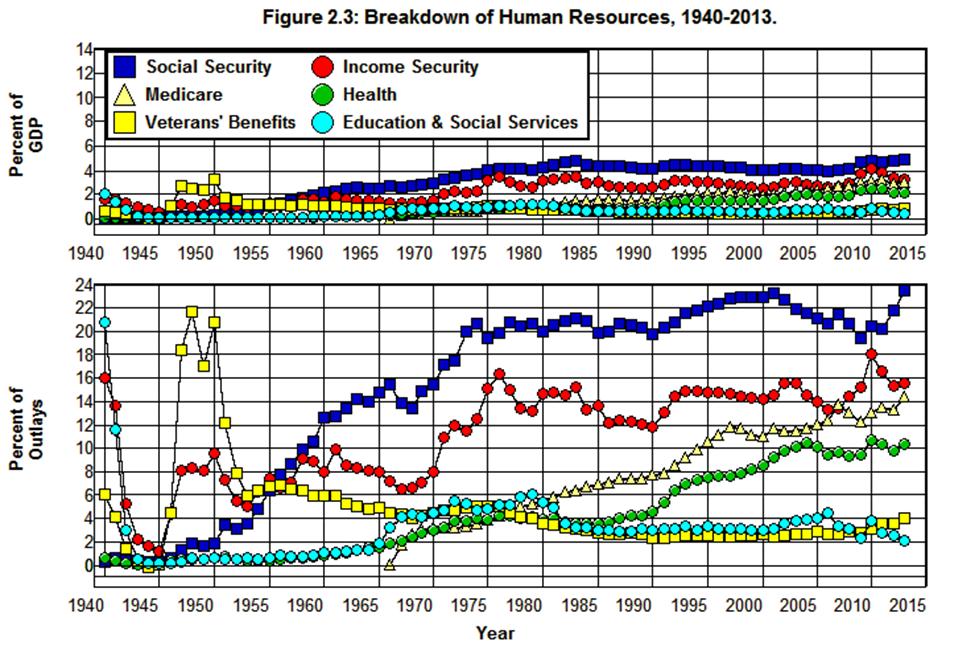
As was noted above, Human Resources is where our social-insurance programs are to be found. The largest component in this category of the budget in 2013, as broken down in the official statistics, is Social Security followed by Income Security, Medicare, Health, Veterans Benefits, and Education & Social Services.[1x8] Expenditures in these categories are plotted from 1940 through 2013 in Figure 2.3.
Source: Office of Management and Budget. (3.1 10.1)
There are three things worth noting about Figure 2.3 and the Human Resources category of the budget:
1. The Social Security and Income Security programs that begun during the New Deal grew systematically until they reached their maturity in the 1980s. These components of Human Resources increased to 23.6% and 15.5% of the budget, respectively, as they grew to 4.9% and 3.2% of GDP by 2013. These two budget categories are expected to increase gradually until 2035 as the baby boomers retire and then decrease somewhat from then on. (SSA)
2. Veterans Benefits and Education & Social Services are a relatively insignificant portion of this category of the budget and of the budget itself. Each comprises less than 5% of the budget and less than 1% of GDP. In addition, Education & Social Services has been cut substantially since 1980 and Veterans Benefits is barely above where it was in 1980s in spite of the needs of veterans that have arisen as a result of the Afghan and Iraq wars. There is no reason to believe that much can be gained in dealing with our deficit/debt problem from cuts in these components of the budget.
3. While both Social Security and Income Security have been relatively stable relative to the GDP and the budget and have not increased substantially since the 1990s, both the Medicare and Health components of the budget have trended upward since 1965 and there is little indication that this trend will not continue in the future. Even though Social Security and Income Security are the largest single components of Human Resource today, they have been less than the sum of Medicare and Health since 2004. While Social Security and Income Security are both expected to increase in the future, the increases in these two components is predictable in a way that the increases in Medicare and Health are not.
Social Security increased by 1.7% of GDP from 1965 through 2007 and is expected to increase by an additional 2.0% of GDP by 2035. The sum of Medicare and Health increased by 4.6% of GDP over the same period, and there is no way of knowing what will happen to this sum in the future. It is the rise in healthcare costs that presents the greatest challenge in the future when it comes to managing the federal budget, not Social Security and Income Security.
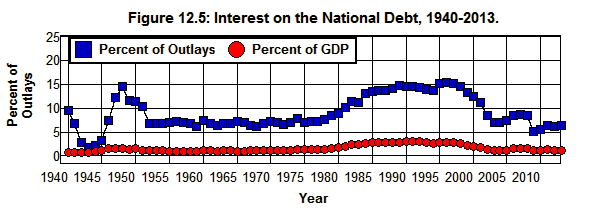
Net Interest
Net Interest in Figure 2.2 is interest paid by the federal government net of the interest paid within the government. In other words, it is the interest paid on the Net National Debt in Figure 1.2. This category increased dramatically in the 1980s. It reached a peak in 1991 at 14.7% of the budget and—3.2% of GDP, substantially above its 1959 post-war low of 6.3% of the budget and 1.1% of GDP. Net Interest subsequently fell to 6.4% of the budget and 1.3% of GDP in 2013.
Physical Resources
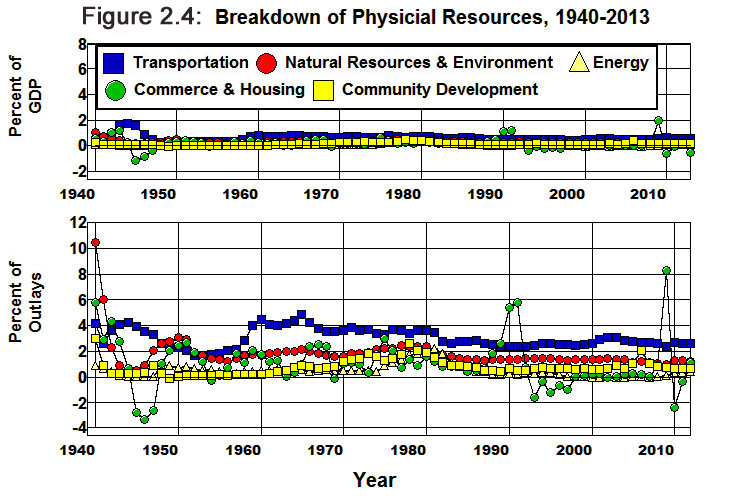
A breakdown of the Physical Resources category of the federal budget is given in Figure 2.4. This category consists of Transportation, Natural Resources & Environment, Energy, Commerce & Housing, and Community Development.
Source: Office of Management and Budget. (3.1 10.1)
None of the items in the Physical Resources portion of the budget have exceeded 1% of GDP since 1950 except Commerce & Housing[19] and Transportation, and only these two items have exceeded 3% of the budget in the past 60 years. Aside from the fact that the programs in this portion of the federal budget are rather small and play a vital role in the functioning of our economic system, all of these programs have been cut substantially since 1980. There is no reason to believe that much can be gained from further cuts in these programs in dealing with the deficit.
All Other Functions
Finally, we get to All Other Functions in Figure 2.2. A breakdown of this category is presented in Figure 2.5. It includes International Affairs, Science & Technology, Agriculture, Administration of Justice, General Government, and Undistributed Offsetting Receipts.[20]
Source: Office of Management and Budget. (3.1 10.1)
Even though these functions of the federal government play a vital role in the functioning of our society and of our economic system, each of these functions represents a very small part of GDP and of the federal budget. Since 1990, none have exceeded 0.4% of GDP or 2% of the budget and most hover around 0.2% of GDP and 1% of the budget. International Affairs,[21] Agriculture, Science and Technology, and General Government have all been cut substantially since 1980. Only Administration of Justice has increased since 1980 and has, in fact, increased fivefold since 1950 as a percent of our economy—mostly as a result of the war on drugs that began in the Nixon administration and has been fought ever so valiantly ever since at ever greater expense.
Federal Revenue
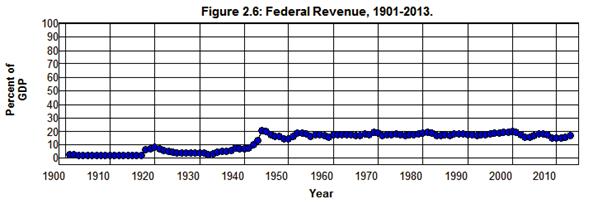
Next we look at the revenue side of the budget. Figure 2.6 shows the Federal Revenue as a Percent of GDP from 1901 through 2013.
Source: Office of Management and Budget (1.1 10.1), Bureau of Economic Analysis. (1.1.5)
The dramatic effect the Great Depression, World War II and the Cold War had on the size of the federal government can be seen in this figure as well as in the plot of federal outlays in Figure 2.1. Federal Revenue was less than 1% of GDP prior to World War I and stood at 3.8% of GDP in 1929. Then came the Great Depression of the 1930s. By 1941 Federal Revenue had increased to 7.5% of GDP. After the dramatic increase to 20.5% of GDP during the war, they receded to a post war low of 14.1% of GDP in 1950—a level that was never to be seen again. Federal Revenue reached a high of 19.9% of GDP in 2000 and a low of 14.6% in 2009.
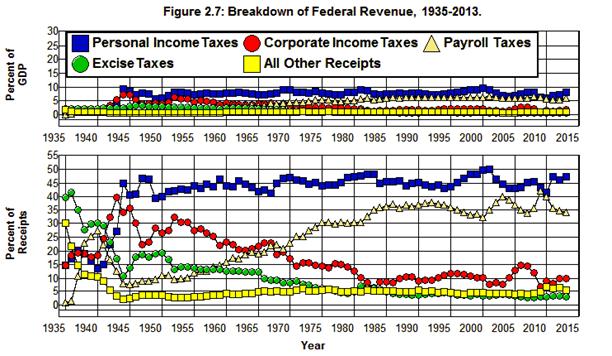
Figure 2.7 gives a breakdown of the various sources of Federal Revenue from 1935 through 2013.
Source: Office of Management and Budget. (2.3 10.1)
It is clear from this figure that the way in which the federal government is financed has changed dramatically since 1935. Prior to World War II, the largest source of Federal Revenue was Excise Taxes. During the war, Personal Income Taxes and Corporate Income Taxes took center stage.
Federal Excise Taxes
Excise Taxes are taxes on specific goods or services, such as taxes on tobacco, alcohol, and gasoline. Their importance in funding the federal government has declined steadily since the 1930s. Excise Taxes comprised 40% of Federal Revenue and 2.0% of GDP in 1935. In 2013 they amounted to only 3.0% of Federal Revenue and 0.5% of GDP.
Personal Income Taxes
In 1935 Personal Income Taxes were 14.7% of Federal Revenue and 0.75% of GDP. During World War II they peaked at 45% of the total and 9.2% of GDP. They then fluctuated between a low of 39% of Federal Revenue and 5.6% of GDP in 1949, and a high of 50% of Federal Revenue and 9.9% of GDP in 2000. In 2013 Personal Income Taxes stood at 47% of Federal Revenue and 7.9% of GDP.
Corporate Income Taxes
Corporate Income Taxes were less than 1% of GDP and amounted to 14.7% of Federal Revenue in 1935. They then rose to 5.9% of GDP and 32.1% of revenue by 1952 and declined to 2.0% of GDP and 10.2% of revenue by 2000. In 2013 Corporate Income Taxes had fallen to 1.7% of GDP and 9.9% of Federal Revenue.
Payroll Taxes
As is clear from Figure 2.7, Payroll Taxes have played a major role in financing the increase in the federal budget since 1935 going from virtually nothing in that year to a high of 42.3% of Federal Revenue in 2009. Not only have Payroll Taxes financed Social Security’s retirement and disability and Medicare’s Part A programs from their inception, Payroll Taxes have contributed some $3.0 trillion to the federal government’s general fund since 1984 as the Social Security Administration built up the OASDI and Medicare trust funds by this amount. Payroll Taxes were 34% of Federal Revenue in 2013 and 5.7% of GDP.
All Other Receipts
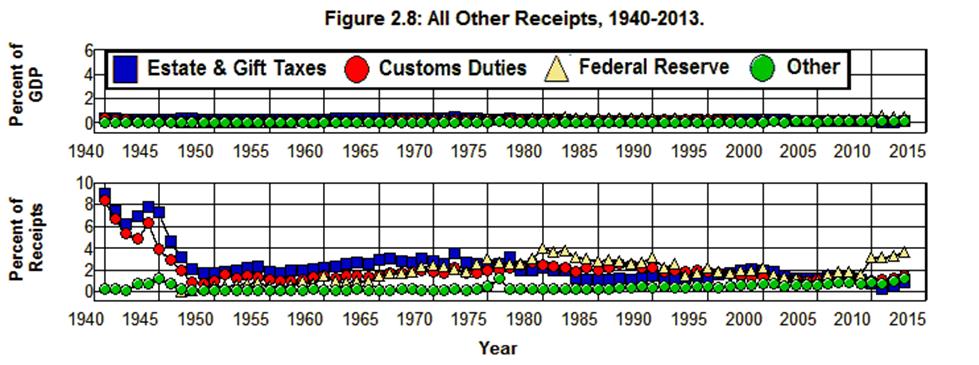
A breakdown of All Other Receipts from 1940 through 2013 is plotted in Figure 2.8.
Source: Office of Management and Budget. (2.5 10.1)
All Other Receipts have been relatively insignificant since the 1930s. Its three largest components are Estate & Gift Taxes, Customs Duties, and Federal Reserve Earnings. Since 1950, All Other Receipts have averaged 4.6% of Federal Revenue and 1.2% of GDP and have been less than 7% of Federal Revenue, and never exceeded 2% of GDP. All Other Receipts stood at 5.5% of Federal Revenue in 2013 and 0.92% of GDP.
Summary and Conclusions
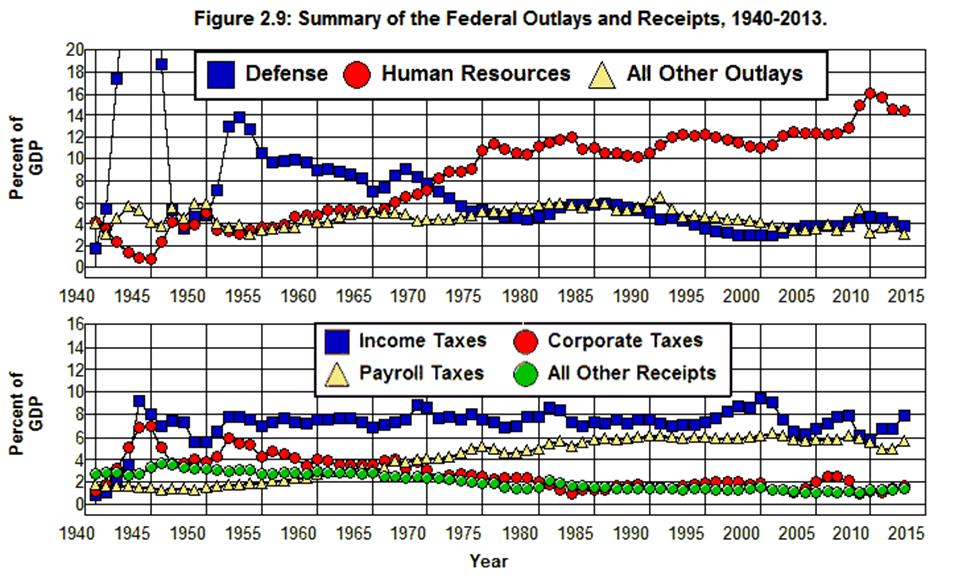
The expenditure and revenue sides of the budget from 1940 through 2013 are summarized in Figure 2.9
Source: Office of Management and Budget. (3.1 2.1 10.1)
It is clear from the graphs in this figure that the major components on the expenditure side of the budget today lie in the Human Resources category of the budget.
It is also clear from the graphs in this figure that the primary mechanisms by which the increase in the Human Resources has been financed over the past 60 years is through decreasing expenditures for Defense and an increasing Payroll Taxes. The decrease in Defense and increase in Payroll Taxes were used to finance a reduction in the Corporate Taxes and All Other Receipts collected by the federal government as well. The reduction of Corporate Taxes has been especially dramatic in this regard.
Finally, it is clear from Figure 2.9 that if we are to have less government the place we must cut the budget is in Human Resources and possibly Defense. Virtually everything else has been cut to the bone since 1980. In fact, by 2013 All Other Outlays relative to the size of the economy (3.1% of GDP) was below where it had been at any point during the previous seventy-three years. This has occurred in spite of the obvious need for growth in the Transportation, Natural Resources & Environment, Energy, Community & Regional Development, International Affairs, Science & Technology, Agriculture, Administration of Justice, and General Government functions of the federal government (Figure 2.4 and Figure 2.5) as our population has grown and become more urbanized, our role in the world has become more complicated, and our economic system has faltered as a result of the government's inability to perform the basic functions that it must perform in these areas if we are to prosper. (Amy Musgrave Lindert Kleinbard)
As was noted above, the Human Resources portion of the budget is made up of the social-insurance programs that have grown out of Roosevelt's New Deal. Given the importance of these programs in the current debate over debt reduction and the size of government, it is worth looking at the history of our social-insurance programs in detail. We will do this in the next two chapters.
Appendix on the Federal Budget in 2013
Table 2.1 gives the expenditures in each functional and subfunctional category in the Office of Management and Budget’s Table 3.2—Outlays by Function and Subfunction along with the percent of GDP and of the outlays allocated to each category in 2013.
Table 2.1: Breakdown of Federal Budget by Function and Subfunction, 2013.
Function and Subfunction, 2013
Billions of
DollarsPercent of
GDPPercent of
Budget050 National Defense:
$633.4
3.81%
18.33%
051 Department of Defense-Military:
$607.8
3.66%
17.59%
Military Personnel
$150.8
0.91%
4.37%
Operation and Maintenance
$259.7
1.56%
7.52%
Procurement
$114.9
0.69%
3.33%
Research, Development, Test, and Evaluation
$66.9
0.40%
1.94%
Military Construction
$12.3
0.07%
0.36%
Family Housing
$1.8
0.01%
0.05%
Other
$1.4
0.01%
0.04%
053 Atomic energy defense activities
$17.6
0.11%
0.51%
054 Defense-related activities:
$8.0
0.05%
0.23%
150 International Affairs:
$46.4
0.28%
1.34%
151 International development and humanitarian assistance
$22.8
0.14%
0.66%
152 International security assistance
$9.9
0.06%
0.29%
153 Conduct of foreign affairs
$13.0
0.08%
0.38%
154 Foreign information and exchange activities
$1.5
0.01%
0.04%
155 International financial programs
-$0.8
-0.01%
-0.02%
250 General Science, Space, and Technology:
$28.9
0.17%
0.84%
251 General science and basic research
$12.5
0.08%
0.36%
252 Space flight, research, and supporting activities
$16.4
0.10%
0.48%
270 Energy:
$11.0
0.00%
0.00%
271 Energy supply
$9.0
0.05%
0.26%
272 Energy conservation
$1.2
0.01%
0.04%
274 Emergency energy preparedness
$0.2
0.00%
0.01%
276 Energy information, policy, and regulation
$0.5
0.00%
0.02%
300 Natural Resources and Environment:
$38.1
0.23%
1.10%
301 Water resources
$7.7
0.05%
0.22%
302 Conservation and land management
$10.7
0.06%
0.31%
303 Recreational resources
$3.5
0.02%
0.10%
304 Pollution control and abatement
$9.6
0.06%
0.28%
306 Other natural resources
$6.6
0.04%
0.19%
350 Agriculture:
$29.5
0.18%
0.85%
351 Farm income stabilization
$25.0
0.15%
0.73%
352 Agricultural research and services
$4.4
0.03%
0.13%
370 Commerce and Housing Credit:
-$83.2
-0.50%
-2.41%
371 Mortgage credit
-$87.9
-0.53%
-2.54%
372 Postal service
-$1.8
-0.01%
-0.05%
373 Deposit insurance
$4.3
0.03%
0.12%
376 Other advancement of commerce
$2.2
0.01%
0.06%
400 Transportation:
$91.7
0.55%
2.65%
401 Ground transportation
$60.0
0.36%
1.74%
402 Air transportation
$21.5
0.13%
0.62%
403 Water transportation
$9.8
0.06%
0.28%
407 Other transportation
$0.4
0.00%
0.01%
450 Community and Regional Development:
$32.3
0.19%
0.94%
451 Community development
$7.8
0.05%
0.23%
452 Area and regional development
$1.5
0.01%
0.04%
453 Disaster relief and insurance
$23.0
0.14%
0.67%
500 Education, Training, Employment, and Social Services:
$72.8
0.44%
2.11%
501 Elementary, secondary, and vocational education
$42.4
0.26%
1.23%
502 Higher education
-$0.5
0.00%
-0.02%
503 Research and general education aids
$3.7
0.02%
0.11%
504 Training and employment
$7.3
0.04%
0.21%
505 Other labor services
$1.9
0.01%
0.05%
506 Social services
$18.1
0.11%
0.52%
550 Health:
$358.3
2.16%
10.37%
551 Health care services
$321.8
1.94%
9.32%
552 Health research and training
$32.9
0.20%
0.95%
554 Consumer and occupational health and safety
$3.6
0.02%
0.10%
570 Medicare:
$497.8
3.00%
14.41%
600 Income Security:
$536.5
3.23%
15.53%
601 General retirement and disability insurance (excluding social security)
$7.0
0.04%
0.20%
602 Federal employee retirement and disability
$131.7
0.79%
3.81%
603 Unemployment compensation
$70.7
0.43%
2.05%
604 Housing assistance
$46.7
0.28%
1.35%
605 Food and nutrition assistance
$109.7
0.66%
3.18%
609 Other income security
$170.7
1.03%
4.94%
650 Social Security:
$813.6
4.90%
23.55%
700 Veterans Benefits and Services:
$138.9
0.84%
4.02%
701 Income security for veterans
$65.9
0.40%
1.91%
702 Veterans education, training, and rehabilitation
$12.9
0.08%
0.37%
703 Hospital and medical care for veterans
$52.5
0.32%
1.52%
704 Veterans housing
$1.3
0.01%
0.04%
705 Other veterans benefits and services
$6.3
0.04%
0.18%
750 Administration of Justice:
$52.6
0.32%
1.52%
751 Federal law enforcement activities
$27.3
0.16%
0.79%
752 Federal litigative and judicial activities
$14.6
0.09%
0.42%
753 Federal correctional activities
$6.9
0.04%
0.20%
754 Criminal justice assistance
$3.8
0.02%
0.11%
800 General Government:
$27.8
0.17%
0.80%
801 Legislative functions
$3.7
0.02%
0.11%
802 Executive direction and management
$0.5
0.00%
0.01%
803 Central fiscal operations
$12.1
0.07%
0.35%
805 Central personnel management
$0.4
0.00%
0.01%
806 General purpose fiscal assistance
$7.9
0.05%
0.23%
808 Other general government
$6.0
0.04%
0.17%
809 Deductions for offsetting receipts
-$2.7
-0.02%
-0.08%
900 Net Interest:
$220.9
1.33%
6.39%
950 Undistributed Offsetting Receipts:
-$92.8
-0.56%
-2.69%
Total outlays
$3,454.6
20.79%
100.00%
Source: Office of Management and Budget (3.2 10.1)
Endnotes
[16] Not unlike the faith economist had leading up to the Crash of 2008. See Krugman and Where Did All The Money Go?
[17] The importance of the existence of these programs in helping us avoid the kinds of depravations and misery we experienced during the Great Depression following the crash of 2008 are examined in Where Did All The Money Go?
[18] The social-insurance programs that fall under the heading of Income Security and Health in the federal budget are examined in detail in Chapter 3 and Chapter 4 below.
[19] Commerce and Housing Credit (Commerce & Housing) includes government enterprises such as the FDIC, NCUA, U.S. Postal Service, FHA, and GNMA. There will be a negative value for expenditures in this category of the budget in those years in which the aggregate net profits of these enterprises is positive, and a positive value when the aggregate net profit of these enterprises is negative.
[20] The federal government takes in money other than through taxes in the form of fees and other payments. These payments often arise from businesslike transactions with the public (e.g., fees collected by the FDIC for deposit insurance) and are referred to as offsetting receipts in the federal budget. In most cases they are assigned to the specific functional category in which they arise, and are treated as a negative expenditure within the functional category to which they are assigned rather than as a source of revenue or a receipt that is available to the rest of the government. As a result, the outlays that appear in the individual functional categories of the budget indicate the governmental resources allocated to that category net of the resources received in that category through market mechanisms.
There are some sources of non-tax receipts that do not arise from businesslike transactions with the government (e.g., payments by Federal agencies to employee retirement funds) or that do arise from businesslike transactions with the government but are so large that they would distort the functional totals if they were assigned to the functional category in which they arise (e.g., payments on federal oil and gas leases). These payments are not assigned to a particular functional category in the budget, and are referred to as Undistributed Offsetting Receipts. They represent funds that are available to the general fund to be distributed throughout the budget. As a result, these funds are treated as a negative outlay in the federal budget, rather than as a source of (tax) revenue. These negative outlays are added in as a separate item in order to arrive at total outlays. (See: Undistributed Offsetting Receipts.)
Undistributed Offsetting Receipts reached a high of 6.2% of the budget and 1.1% of GDP in 1974 and a low of 1.1% of the budget and 0.4% of GDP in 1999 through 2002. This category of the budget has averaged 0.7% of GDP and 3.3% of the budget since 1970 and stood at 0.6% of GDP and 2.7% of the budget in 2013.
[21] It is, perhaps, worth noting that less than half of the International Affairs budget is devoted to humanitarian foreign aid. The rest funds the operations of our foreign embassies and provides for military and law enforcement assistance to foreign governments. A breakdown of the federal budget by Function and Subfunction along with the percent of GDP and of the federal budget that each program represented in that year is given in the Appendix at the end of this chapter.