![]()
![]()
![]()
![]()
![]()
![]()
Prologue and Chapter 1
From
How Lower Taxes, Less Government, and Deregulation Redistribute Income and Create Economic Instability
[T]he ideas of economists and political philosophers, both when they are right and when they are wrong, are more powerful than is commonly understood. Indeed, the world is ruled by little else. Practical men, who believe themselves to be quite exempt from any intellectual influences, are usually the slaves of some defunct economist. Madmen in authority, who hear voices in the air, are distilling their frenzy from some academic scribbler of a few years back. I am sure that the power of vested interests is . . . exaggerated compared with the gradual encroachment of ideas. Not, indeed, immediately, but after a certain interval; for in the field of economic and political philosophy there are not many who are influenced by new theories after they are twenty-five or thirty years of age, so that the ideas which civil servants and politicians and even agitators apply to current events are not likely to be the newest. But, soon or late, it is ideas . . . which are dangerous for good or evil.
A new scientific truth does not triumph by convincing its opponents and making them see the light, but rather because its opponents eventually die, and a new generation grows up that is familiar with it.
Max Planck,I am a state-school economist. By that I mean I had the privilege of teaching undergraduate economics students at state colleges and universities for some twenty years prior to 1987. I believe this gives me a perspective on the discipline of economics that is somewhat different from those who have not been equally blessed. It also helps that I left academia in 1987 and no longer had to deal with the revolution that had been taking place in the discipline for some time—a revolution that seems to have come to fruition in 2008.
I spent the twenty years leading up to 2008 reading mostly mathematics and statistics books and paid little attention to the real world other than to watch the news. The financial crisis that reached its climax in that year took me entirely by surprise. I knew there was a problem in the housing market and that economic nonsense had been at the center of the political debate in our country for over thirty years, but I assumed, naively it turned out, that cooler heads would prevail, and sound economic policies would always be enforced. I had no idea our financial institutions would be allowed to overextend themselves to such an extent they could bring down the economy of the entire world. After the crash I decided to set aside other pursuits and try to find out what had been going on in the world of economics since I left academia.
When I began this quest I was stunned to find the extent to which free-market ideological beliefs had taken over the discipline of economics. I have a decidedly pragmatic, nonideological view of the world derived from an inductive analysis of history and real-world observations aided by deductive reasoning. I emphatically reject any ideological view that begins with first principles and attempts to deduce from those principles the way the world works aided by inductive analysis when history and real-world observations are consistent with those principles and oblivious when they are not.
I consider myself neither a freshwater (Chicago School) nor a saltwater (Keynesian) economist, to use the terms coined by Robert Hall and recently revived to describe the most important division within the discipline of economics today, but rather one who attempts to find the truth and reject the nonsense wherever it may be. If anything, I identify with the traditions of Institutional Economics as exemplified by the writings of Thorstein Veblen, Karl Polanyi, and John Kenneth Galbraith though the influences of Adam Smith, John Stuart Mill, Alfred Marshall, John Maynard Keynes, Paul Samuelson, and Milton Friedman are hard to deny, especially since I was trained within the traditions of Neoclassical Economics.
My rejection of ideology means, of course, that I totally reject the ideological dogma that has defined freshwater economists since the 1930s. I have always seen their elevation of “economic liberalism and free markets above all else” and their relentless struggle against “government intervention” in the economic system as being incomprehensibly naïve if not outright paranoid.
As for saltwater economists, at least they are not hobbled by the ideological blindness created by the doctrinaire approach of freshwater economists, but their adherence to neoclassical methodology leads to a kind of streetlight effect as personified by the man who lost his keys in the park but looks for them under the streetlight because “this is where the light is.” Neoclassical methodology hinders the ability of saltwater economists to see problems and seek solutions that exist beyond the light shed by their neoclassical models. It seems to me this leads to a problem in their ability to understand how we got to where we are today and in formulating effective policies to deal with the root cause of the economic problems we face. This can be seen in the way their neoclassical models lead freshwater economists to recommend expansive monetary policy combined with increasing government expenditures and decreasing taxes to deal with the economic problems created by the housing bubble bursting. These policies, undoubtedly, would have solved our employment problem had they been forcefully applied, but they offer only a short-run solution to this problem, and they do not come to grips with the fundamental long-run problem we face today.
An extraordinary level of monetary expansion was absolutely essential to maintain the stability of the financial system during the crisis in 2008, but there is little reason to believe the quantitative easing that followed has made much of a positive contribution. Even if this policy is successful in reducing real rates of interest and thereby increasing investment and employment, the redistribution effects of the inflation this policy relies upon will do harm, and, in the end, could do more harm than good. This is fairly obvious even within the context of Saltwater Economics. (Stiglitz Summers)
As for increasing government expenditures and decreasing taxes, this is a formula for increasing government deficits and debt. While this may provide a short-run solution to our employment problem it also means increasing the transfer burden on taxpayers as increasing interest payments are transferred from taxpayers to government bondholders. Since government bondholders tend to be among the wealthiest members of our society, increasing government deficits is likely to have the added effect of increasing the concentration of income at the top of the income distribution. This is a problem that is not clearly understood by saltwater economists.
The fundamental difficulty faced by saltwater economists in attempting to understand the problems caused by increase in the concentration of income is that the distribution of income does not appear as a variable in the neoclassical models from which saltwater analysis and, hence, saltwater policy recommendations are derived. As a result, the effects of an increase in the concentration of income on the economic system cannot be examined within these models. (Stiglitz) In order to find answers to questions about how an increase in the concentration of income affects the economic system one must move out from under the light shed by neoclassical models and into the non-neoclassical park where the light is not so good. That’s where I have been for the past five years.
As I recount my journey through the non-neoclassical park in the pages below I come to the inescapable collusion that it was the ideological faith in the self-adjusting powers of free markets on the part of policy makers over the past forty years that has brought us to where we are today. This faith led policy makers to 1) abandon the managed exchange system embodied in the Bretton Woods Agreement, 2) institute the tax cuts that have occurred since 1980, and 3) deregulate our financial system. These policy changes made it possible for our financial institutions to increase debt beyond any sense of reason. These policy changes also led to a rise in our current account deficits (increasing debt to foreigners) and to the financing of speculative bubbles which, when combined with the tax cuts that have occurred since 1980, led to the increase in the concentration of income at the top of the income distribution that we see today.
The resulting increase in the concentration of income has led us to what I consider to be the fundamental problem we face today. Namely, that 1) given the increased concentration of income, 2) the degree of mass-production technology that exists within our economic system, and 3) the size of our current account deficits it is impossible to sustain the mass markets needed to fully employ our economic resources in the absence of a continual increase in debt relative to income.
This is a problem because continually increasing non-federal debt relative to income is unsustainable in the long run since it increases the transfer burden on debtors as income is transferred from debtors to creditors through the payment of interest. This means that eventually the system must breakdown as interest payments increase and non-federal debtors eventually find it impossible to meet their financial obligations. This leads to financial crises in which the financial system must be bailed out by the federal government to keep it from collapsing and bringing the rest of the economic system down with it.
Continually increasing federal debt relative to income is a problem because as interest payments on the federal debt grow they must eventually overwhelm the federal budget. This will make it more and more difficult to fund essential government programs such as Social Security, Medicare, Medicaid, and national defense. And most important, as was noted above, an increase in government debt is likely to contribute toward a further increase the concentration of income. This will make the long-run problem we face worse because a further increase in the concentration of income will increase the rate at which debt must increase relative to income in order to fully employ our resources. Even though the federal government has the legal right to print the money needed to pay the interest on its debt, this does not solve the problem since it is fairly certain that doing so on a continual basis will eventually destabilize the economic system.
As a result, I reject the saltwater policy of increasing government expenditures and decreasing taxes that offers a short-run solution to the problems we face in favor of a policy of increasing government expenditures and increasing taxes in a way that 1) reduces the concentration of income and our current account deficits, 2) deleverages the non-federal sector of our economy, and 3) stabilizes the federal debt relative to GDP.
This is the only long-run solution I have been able to find in the non-neoclassical park I have been wandering in for the past five years. It seems to me that if we do not increase both government expenditures and taxes in a way that stabilizes the federal budget and reduces the concentration of income and our current account deficits, our economic situation can only get worse. In the absence of an increasing debt relative to income our ability to produce will be diminished as our employment problem is solved through the transfer of resources out of those industries that produce for domestic mass markets (our most productive industries) and into those that serve the wealthy few which is, of course, exactly what has been happening in our economy over the past thirty-five years. In addition, our diminished ability to produce through the utilization of mass-production technologies portends stagnation or a fall in the standard of living for the vast majority of our population which is, of course, also exactly what has been happening for the past thirty-five years.
This is the story I tell in the pages below, and, given the nature of the debate within the discipline of economics today, I see little reason to believe this story will change anyone’s mind. There is certainly no hope at all that it will change the minds of freshwater economists as this story flies in the face of their most firmly held ideological convictions. There is, of course, some hope it will motivate saltwater economists to include the distribution of income as a variable in their models in a way that allows them to investigate the effects of the concentration of income on the viability of mass-production technology in the absence of increasing debt. The only real hope, however, is with the young who have not yet formed the opinions that will—for better or for worse—serve them for the rest of their lives. It is to the young that I dedicate this eBook for it is with the young that our hope for the future lies.
Chapter 1: Income, Fraud, Instability, and Efficiency examines the policy changes that have occurred over the past forty years and documents the consequences in terms of the increase in the concentration of income, fraud, economic instability, and economic inefficiency that followed in the wake of these changes.
Chapter 2: International Finance and Trade examines the consequences of these policy changes within the context of international trade and finance and documents the consequences of these changes in terms of the resulting increase in international economic instability and the effects of the resulting balance of payment deficits on domestic producers.
Chapter 3: Mass Production, Income, Exports, and Debt examines the historical relationship between the rise of mass-production technologies in the United States over the past one hundred years and 1) the current account surplus, 2) the concentration of income, 3) the creation of mass markets, 4) changes in debt, and 5) economic instability. It also explains the fundamental thesis of this work. Namely, the extent to which a society is able to take advantage of mass-production technology is limited by the extent of its mass markets which, in turn, are limited by 1) the distribution of income within that society, 2) the extent of its current account surplus, and 3) the extent to which it is possible to increase debt relative to income.
The next seven chapters are devoted to explaining how our financial system works and why an unregulated financial system leads to the increases in debt and the concentration of income that result in economic instability.
Chapter 4: Going Into Debt explains the nature of financial intermediation and examines the relationship between the deregulation of our financial system and the resulting increase in debt that has occurred since 1980. The way in which ideological beliefs came to dominate policy making in the United Sates over the past forty years is discussed along with the way in which the deregulation of our financial system led to the housing bubble in the 2000s, its bursting in 2006, and the financial crisis that began in 2007 just as the lack of financial regulation led to the housing and stock-market bubbles of the 1920s, the Crash of 1929, and the financial crisis that began in 1930.
Chapter 5: Nineteenth Century Financial Crises examines the problems of nineteenth century banking, and explains how a banking system works. This chapter presents the kind of explanation of monetary expansion that can be found in most any economic principles or money and banking textbook, but with a difference. Instead of focusing on how banks create money, the focus is on how banks created debt and on how this debt creation mechanism leads to economic instability in an unregulated financial system.
Chapter 6: The Federal Reserve and Financial Regulation explains 1) the way in which the Federal Reserve controls the amount of currency available to the economy (i.e., the monetary base), 2) how this system evolved in the United States during the Great Depression, and 3) why the experiences of the 1920s and 1930s led to a rejection of the failed nineteenth century ideology of Free-Market Capitalism in favor of a pragmatic regime of regulated-market capitalism.
Chapter 7: Rise of the Shadow Banking System (and the following chapter) examine how our financial system changed with the revival of the failed nineteenth century ideology of Free-Market Capitalism that began among policy makers in the 1970s. The nature of various kinds of financial instruments is explained in this chapter along with the way in which collateralization led to the rise of the shadow banking system.
Chapter 8: Securitization, Derivatives, and Leverage explains the way in which income streams are securitized, the nature of financial derivatives, and the way in which financial derivatives increase leverage and, hence, in the absence of an exchange or clearinghouse, increase instability in the financial system.
Chapter 9: LTCM and the Panic of 1998 chronicles the events that occurred during the Panic of 1998 when a single hedge fund, Long-term Capital Management, posed a threat to the financial stability of the entire world. It is shown that all of the dangers implicit in the way in which our financial system had been deregulated were apparent to those who investigated this incident at the time but that ideological blindness inspired by an almost religious faith in free markets on the part of policy makers and elected officials made it impossible to heed the General Accounting Office’s warnings and regulate shadow banks and the over-the-counter markets for derivatives.
Chapter 10: The Crash of 2008 chronicles the financial crisis that began in 2007 and culminated in the near meltdown of the world’s financial system in 2008. It argues that, given the way in which our financial system had changed in the wake of the financial deregulation that had occurred in the proceeding forty years, this crisis unfolded in a very predictable way. It is also argues that it was the size of the government and its active intervention in the economic system that kept the system from collapsing. It further argues that if the government had not been able to intervene in the way it did in the wake of the Crash of 2008 we would have suffered the same kind of fate we suffered in the 1930s.
Chapter 11: Lessons from the Great Depression examines the government’s response to the economic crisis during the Great Depression and shows how the conservative monetary and fiscal policies advocated by free-market ideologues today are the same policies that drove the economy into the depths of the Great Depression in the 1930s just as they have had a similar effect on Europe since 2010. It also argues that the kind of stagnation we experienced in the 1930s, and are in the midst of today, requires decisive government action and that tax increases played an important role in stabilizing the growth of federal debt during the depression and following World War II.
Chapter 12: Coming to Grips with Reality argues that today we face the same kind of situation we faced in the 1930s when, given the degree of mass-production technology available in the economy, the existing distribution of income and current account surpluses could not provide the mass markets needed to achieve full employment in the absence of an increase in debt relative to income. The only way we can create the mass markets needed to achieve full employment—and sustain the degree of mass-production technology that exists in our economy—in this situation is by 1) increasing our current account surplus (i.e., reducing our current account deficit), 2) increasing debt relative to income, or 3) by reducing the concentration of income.
Given the size of our economy, we cannot solve our employment problem entirely by increasing our current account surplus, (Stiglitz) and since we have apparently reached a point at which further increases in non-federal debt is no longer possible this leaves only 1) continually increasing federal debt relative to GDP or 2) reducing the concentration of income. Since continually increasing federal debt relative to GDP is, at best, only a short-run solution and is likely to increase the concentration of income further, this leaves reducing the concentration of income as the only long-run solution that allows us to take full advantage of the mass-production technology that is available to us.
If we do not reject the kind of ideological nonsense that has guided economic policy for the past forty years and face this problem head on with a substantial increase in government expenditures and taxes that are specifically designed to 1) reduce the concentration of income, 2) achieve a reasonable balance in our current account, 3) deleverage the non-federal sector of the economy, and 4) rebuild the physical infrastructure and social capital that we have allowed to depreciate over the past forty years our economic situation will continue to deteriorate, and the standard of living of the vast majority of our population will continue to stagnate or fall as our ability to take advantage of mass-production technologies is diminished.
Chapter 1: Income, Fraud, Instability, and Efficiency
There’s class warfare, all right, but it’s my class, the rich class, that’s making war, and we’re winning. Warren E. Buffett
The changes in economic policy that took place during the forty years leading up to the financial crisis that began in 2007 are astounding. This is particularly so when it comes to the tax code. The maximum marginal income tax was reduced from 70% to 35%, the maximum capital gains tax from 28% to 15.7%, the maximum corporate profits tax from 50% to 34%, the maximum tax on dividends from 70% to 15%, and the maximum marginal estate tax from 70% to 35%. At the same time, payroll taxes were increased as were taxes on cigarettes, gasoline, and other sales and excise taxes as government fees and fines and the tuition at public colleges and universities were increased as well. All of these changes have made our system of government finance more regressive—that is, they increased the proportion of income taken by the government from low and middle-income families relative to the proportion taken from upper-income families. (PCCW)
Changes in the area of market regulation have been particularly dramatic as well. Much of our regulatory system had been dismantled, either through legislative changes, deliberate under funding of the regulatory agencies, or through the appointment of individuals to head these agencies who did not believe in regulating markets and were willing to minimize the enforcement of existing regulations. (Frank Kuttner Amy NYT Bair)
A third area of economic policy in which there have been profound changes is in the area of international finance and trade. Of particular importance was the abandonment in 1973 of the managed international exchange system set up by the Bretton Woods Agreement in 1944 and replacing it with what became known as the Washington Consensus which championed unrestricted international finance and trade. This eventually led to innumerable bilateral trade agreements negotiated with China after Nixon's historic visit in 1972, the North American Free Trade Agreement in 1994, and our joining the World Trade Organization in 1995. (Wilson Stiglitz Galbraith Reinhart Philips Morris Eichengreen Rodrik)
All of these changes were championed in the name of economic efficiency and have, in fact, made it possible for countless individuals to amass huge amounts of wealth over the past forty years. What’s wrong with that? Haven’t we all benefited from the generation of all that wealth? Well, not exactly.
Changes in the Distribution of Income
It is instructive to look at how the distribution of income has changed since the onset of the changes in economic policy outlined above.
Bottom 90%
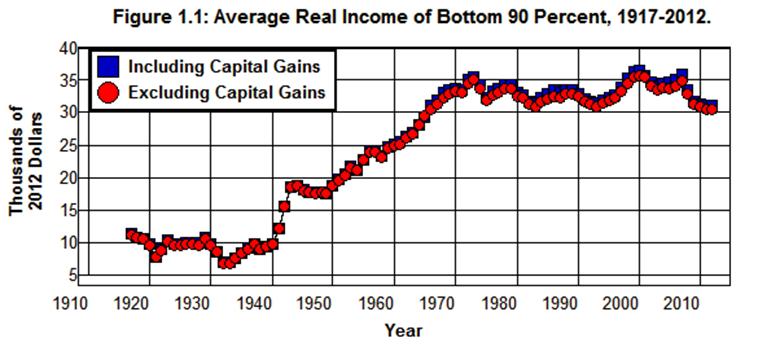
Figure 1.1 shows the average real income (measured in 2012 prices, including and excluding capital gains) of all families in the bottom 90% of the income distribution in the United States from 1917 through 2012. In 2012 this group consisted of 145 million families that received an income (including capital gains) of $113,820 or less. The average income for this group was $30,997 in 2012.
Source: The World Top Incomes Database.
It is clear from Figure 1.1 that the families at the Bottom 90% of the income distribution did not benefit at all from the changes in taxes, regulations, and international finance and trade that occurred from 1973 through 2012. While the average real income of this group rose dramatically from 1933 through 1973, increasing by a factor of 5, it trended downward from 1973 through the 1980s and didn't start to trend upward again until 1993. This upward trend was short lived, however, as the real income for the Bottom 90% began to decrease again after 2000.
The average real income of the Bottom 90% of the income distribution actually fell by 13% during the 39 year period from 1973 through 2012. This 13% decrease provides a stark contrast to the 368% increase in real income this group experienced in the 39-year period that proceeded 1973. In absolute terms, the average real income of the bottom 90% increased by $27,985 from 1934 through 1973 and fell by $4,587 from 1973 through 2012. The $30,997 average income the bottom 90% received in 2012 was actually less than the $31,006 average this income group received 46years earlier in 1966.
The fall in average real income from 1973 through 2012 received by the Bottom 90% of the income distribution is particularly stark in light of the 104% increase in the productivity of labor that took place in the economy during this period. None of the benefits of this increase in productivity of labor went to the bottom 90% of the income distribution. (Saez Gordon Sum)
Top 90-99%
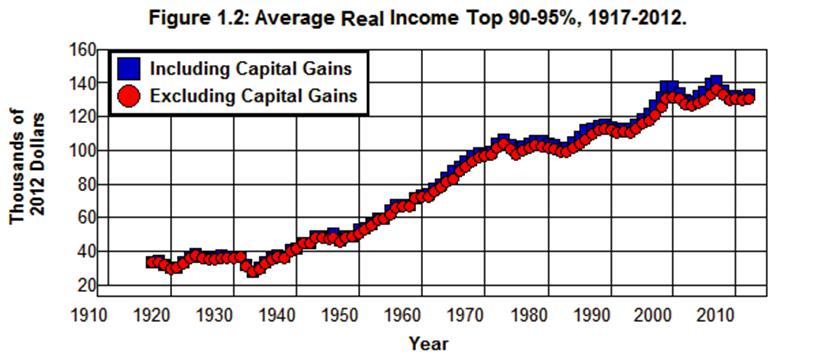
As is indicated in Figure 1.2, the situation was somewhat better for families in the Top 90-95% of the income distribution. In 2012, this group consisted of the 8.0 million families that received an income between $113,820 and $161,438. The 2012 average income for this group was $133,530.
Source: The World Top Incomes Database.
Like the Bottom 90%, the average real income of Top 90-95% rose dramatically from 1933 through 1973, increasing by a factor of 3.75. After 1973, its average income leveled off but began an upward trend in 1982 that peaked in 2000 and again in 2007. It then receded somewhat by 2012. While the average real income of the Top 90-95% of the population did increase by 25% from 1973 through 2012, this increase for that 39-year period was a mere fraction of the 251% increase this group experienced during the 39 years that proceeded 1973 and a third ($26,704) of the $76,375 increase this group received in absolute terms during that 39-year period.
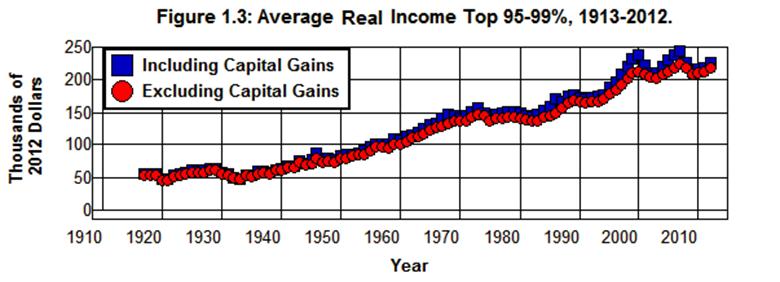
The pattern in Figure 1.2 repeats itself in Figure 1.3 for the Top 95-99% of the income distribution. This group consisted of 6.4 million families that received between $161,438 and $393,941 in 2012 with an average income of $226,405. The 44% increase in real income this group received during the 39-year period following 1973 was, again, far less than the 187% increase that took place during the 39-year period before 1973 and only 68% ($69,669) of the $102,127 increase it had received in absolute terms during that period.
Source: The World Top Incomes Database.
Top 1%
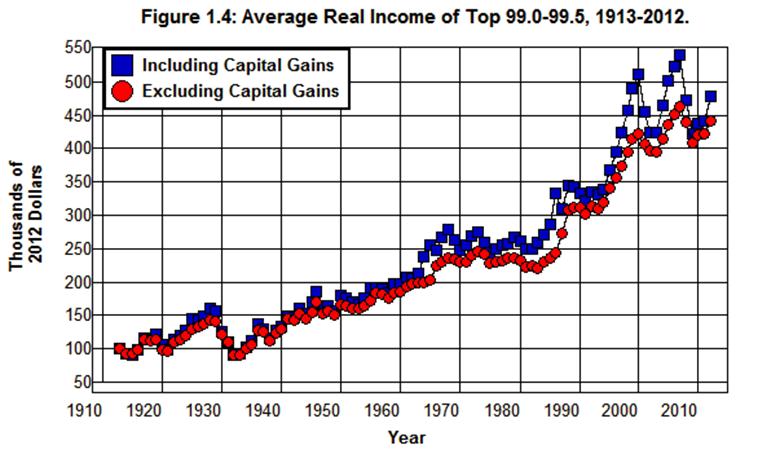
It's not until we get to the top 1% of the income distribution that this pattern changes, though not everyone in this group benefited equally. Figure 1.4 shows the average income of the Top 99.0-99.5% of the income distribution. In 2012, this group consisted of 803,405 families that received between $393,941 and $611,805 with an average income of $477,738.
Source: The World Top Incomes Database.
The average real income of this income group increased by 74% during the 39-year period from 1973 through 2012. This was a significant improvement over lower-income groups. Even though this is less than half of the 165% increase this group received in the 40-year period preceding 1973, the $203,097 increase in real income that took place from 1973 through 2012 is at least greater than the $171,155 increase in real income this group received from 1934 through 1973.
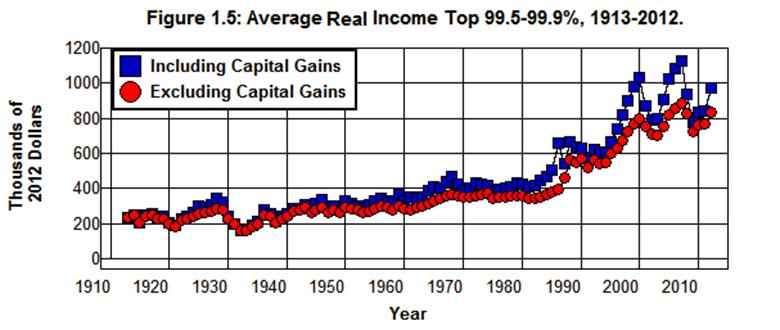
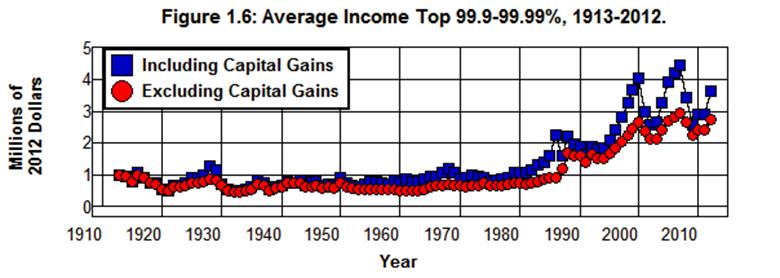
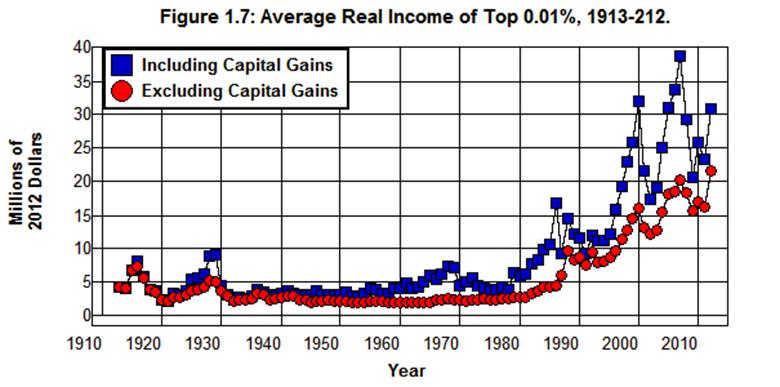
It's not until we get to the top 1/2 of the top 1% that we come to the first income group that unambiguously benefited from the changes in tax, deregulatory, and international policies that have taken place during the past forty years. Figure 1.5 through Figure 1.7 break down the top half of the top1% of the income distribution into three Groups:
Figure 1.5 shows the average income of the Top 99.5-99.9% of the income distribution. In 2012, this group consisted of 642,724 families that received incomes between $611,805 and $1,906,047 with an average income of $969,544.
Source: The World Top Incomes Database.
Here are the true beneficiaries of the changes in tax, deregulation, and international trade policies over the past forty years. While the average real income of the bottom 90% of the population fell from $36 thousand a year in 1973 to $31 thousand a year in 2012, the average real income of the top 0.5% of the population more than tripled:
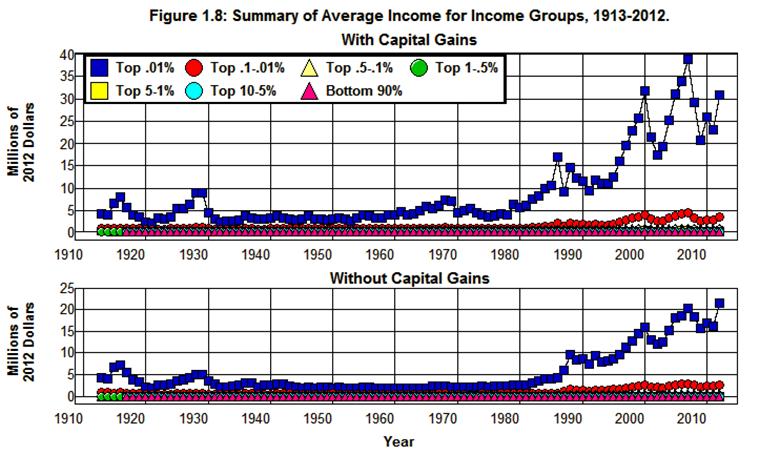
The relative magnitudes of the numbers involved can be seen in Figure 1.8 which plots the average incomes of the various income groups from 1913 through 2012 on the same scale.
Source: The World Top Incomes Database.
Summary
This is what the changes in tax, regulatory, and international finance and trade policies in the name of economic efficiency over the past forty years have led to. Namely, a huge windfall for the upper 1% of the income distribution, a net loss for the Bottom 90% of the income distribution, and relatively little if anything for the 90-99% of the income distribution in between. (Piketty Saez Gordon Sum) What's more, the situation is even worse for those families at the Bottom 90% than the above numbers indicate.
The average income of the Bottom 90% would have fallen even further than the 13% indicated in Figure 1.1 were it not for the fact that the percentage of women who participate in the labor force has increased over 30% since 1973. This suggests that the number of two income families in the Bottom 90% has increased significantly during this period as mothers were forced to leave their children to the care of others and enter the labor force in order to maintain their family's standard of living. When this is combined with a more regressive tax structure—higher payroll taxes, excise taxes, fines and fees, and higher tuition at public colleges and universities—it is clear that the 90% of the population at the bottom of the income distribution is significantly worse off today than it was forty years ago. (NYT Charts)
The Savings and Loan Debacle
In attempting to understand how and why the above changes in income came about, it is instructive to examine the way in which the changes in our tax, regulatory, and international policies have affected our economic, social, and political systems. The place to begin is with the effects on these systems that followed the Depository Institutions Deregulation and Monetary Control Act of 1980 and Garn–St. Germain Depository Institutions Ac of 1982. These two acts 1) lessened the reserve requirements of banks, 2) provided mechanisms to assist failing banks rather than closing them down, 3) phased out interest rate ceilings on bank deposits, and 4) expanded the kinds of loans thrifts (savings and loans and savings banks) could make so as to allow them to become more competitive with the commercial banks. (FDIC Garcia) It was hoped these changes would enhance the level of competition in the financial markets and improve economic efficiency. This is not exactly how this grand experiment in deregulation worked out.
The early 1980s was a particularly ominous time to deregulate the savings and loans. At the end of the 1981 recession, 10% of the savings and loans were insolvent on an accounting basis, and institutions that had no tangible equity at all controlled 35% of the industry's assets. (Black FDIC) These savings and loans—with their federally insured deposits—were allowed to compete on an equal footing with the rest of the financial system in spite of the fact that insolvent financial institutions have nothing to lose by rolling the dice and betting the farm on high stakes investments in trying to recoup their losses. After all, if they win they keep it all. If they lose they just increase their insolvency, and since they were bankrupt to start with, they are no worse off than they were before; their investors and taxpayers (because of the government’s obligations to insured depositors) take the increased losses, not the owners or managers of insolvent savings and loans. (Garcia)
What's more, the reduced regulation and supervision created innumerable opportunities to exploit the system through fraud. As a result, the character of the savings and loan industry changed after deregulation as a new breed of owners, such as Charles H. Keating and Hal Greenwood Jr., began to shift out of home mortgages and into commercial real-estate loans, direct investments in real-estate projects, junk bonds and other securities, and innumerable other risky areas where the potential for fraud abounds—areas they had been barred from entering since the 1930s as a result of the lessons learned from the 1920s. (FDIC Black Akerlof Stewart Garcia)
There was a virtual explosion in Acquisition, Development, and Construction (ADC) loans issued by savings and loans following deregulation whereby real-estate developers were allowed to borrow money for projects with no interest or principal payments for three years. The savings and loans added huge fees to these loans which they booked as income in the year the loans were made. The interest was also booked as income as it accrued over the three years of the loan even though no interest was actually paid. This led, through the magic of accounting, to huge paper profits out of which the owners and managers of the savings and loans paid themselves huge dividends, salaries, and bonuses in real cash even though no cash had been received for fees or interest owed.
What happened when the loans came due and the developers couldn't pay? No problem! The savings and loans just refinanced the loans, added more fees and interest to the principal, booked more paper fee and interest income, and paid themselves more dividends, salaries, and bonuses in real cash. And they were allowed to finance all of this through brokered deposits—federally insured certificates of deposit that were sold by brokerage firms, such as Merrill Lynch, to investors all over the country. The money from federally insured brokered deposits allowed the savings and loans to expand their deposit base, expand their ADC loans, finance innumerable other fraudulent schemes, increase their paper profits, and to come up with the real cash necessary to finance the huge payments of dividends, salaries, and bonuses that the managers and owners took out of these institutions. (Black Akerlof Stewart FDIC)
While this was going on, the inflow of credit into a number of regional commercial real-estate markets that accompanied this expansion of savings and loan activity, mostly in the Southwest and Northeast, started speculative booms in these markets. As the speculative bubbles in these markets developed the fraudulently managed institutions began to threaten the honestly managed institutions—not just among the savings and loans but among the savings and commercial banks as well. Fraudulently managed savings and loans bid fiercely for brokered deposits as they bid up the rates paid on these deposits. This, in turn, increased costs in the entire financial system as the fraudulently managed savings and loans dug the hole deeper for everyone. Honestly managed institutions that were forced to, or were naively willing to invest in the booming commercial real-estate markets made the situation worse as the speculative bubbles in these markets grew.
ADC scams were not the only savings and loan scams that followed in the wake of the financial deregulation of the early 1980s. Deregulation made it possible for Michael Milken and other corporate raiders of the 1980s to finance their leveraged buyouts and hostile takeovers by funneling the junk bonds they issued into captive savings and loans. The corporate raiders used the assets of the target companies as collateral for the junk bonds they issued. The proceeds from the sale of those bonds were then used not only to pay off the existing stockholders but to pay huge dividends and bonuses to the raiders themselves as they drove the companies they took over deeper and deeper into debt. (Black Stewart)
As the speculative bubbles in the markets fueled by ADC scams burst and the companies taken over in junk bond scams began to go bankrupt toward the end of the 1980s and into the 1990s, the result was the first major financial crisis in the United States since the Great Depression. (FDIC) Some 1,300 savings institutions failed, along with 1,600 commercial banks. That amounted to almost a third of all savings institutions along with 10% of all commercial banks in existence at the time. By comparison, only 243 banks failed from 1934 through 1980. It cost the American taxpayer $130 billion to reimburse the depositors in the failed institutions, and the near meltdown of the financial system that resulted was a precursor to the 1990-1991 recession. (Black FDIC Krugman Akerlof Stewart) In the end, the corporate raiders and the owners and managers of the savings and loans walked away with billions; taxpayers took the losses.
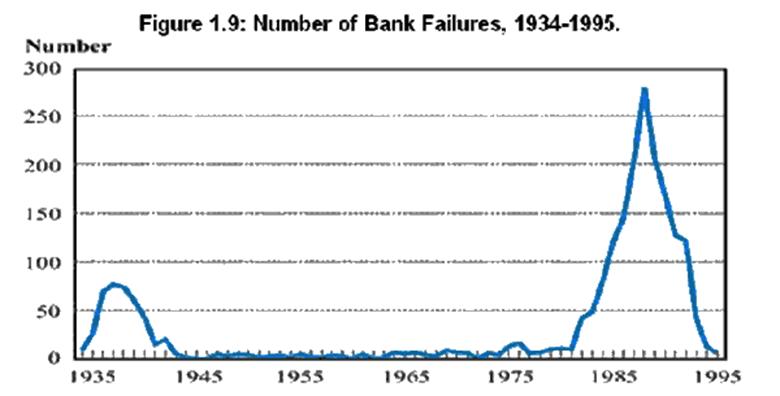
While the number of depository institutions that failed during this crisis was only a third of the number that failed during the Great Depression, the extraordinary nature of the Savings and Loan Crisis is indicated by the graph constructed by the FDIC displayed in Figure 1.9.
Source: FDIC
This chart shows the number of FDIC insured commercial and savings banks that failed each year from 1934 through 1995. While it includes only the 1,600 FDIC insured institutions that failed and does not include the 1,300 failed savings and loans insured by the FSLIC, it clearly indicates the degree of stability in the system from the end of World War II through the 1970s before the era of deregulation began in earnest, and the degree to which deregulation in the 1980s destabilized the system.[1]
The Rise of Predatory Finance and Corruption
Those who were responsible for deregulating the financial system during the 1980s were, of course, shocked, shocked to find that their actions had led to a massive outbreak of fraud, but this outbreak was to be expected. After all, the main function of government is to enact and enforce the law. This fundamental governmental function cannot be performed in a fair or just or efficient manner by private enterprise guided by the profit motive. It can only be performed in a fair and just and efficient manner by a democratically elected government that is dedicated to this end, and the way in which a democratically elected government that is dedicated to this end enacts and enforces the laws against fraud in the financial system is through the regulation and supervision of financial institutions. It should be no surprise that reducing the regulation and supervision of financial institutions led to an increase in fraud perpetrated by those in charge of these institutions. This is especially so in light of the tax cuts of the 1980s which reduced the top marginal tax rate from 70% in 1980 to 28% by 1988. These lower tax rates on ultra high incomes made it possible for massive fortunes to be made through fraud within these institutions.
While there was an attempt by Congress to reregulate the financial markets in the late 1980s and early 1990s, and taxes were raised somewhat during the late Bush I and early Clinton administrations, (TF TAP) the cat was out of the bag. The fortunes made by those who looted the savings and loans during the 1980s clearly demonstrated how lower tax rates on ultra high incomes combined with a lack of oversight on the part of government regulators made it possible for fortunes to be made by those willing to bend or ignore the law. Even though over a thousand individuals associated with the savings and loan debacle were convicted of felonies, many, if not most were able to walk away with their fortunes intact. (Black Akerlof Stewart) This was the lesson learned by those at the top of the economic food chain, and this same lesson was drawn from the experiences in other industries as well. (Frontline MSN)
With so much after-tax money involved, the lack of government regulation allowed the entire fiduciary structure of our economic system to become corrupted. Throughout the 1980s and 1990s stockholders lost control of corporations as the corporate governance structure broke down. Boards of directors became vassals of their CEOs, and management salaries and bonuses soared to astronomical levels. Accounting firms found they could make more money advising corporations how to make paper profits in order to justify increases in management salaries and bonuses than they could by providing independent audits of companies' books for stockholders. Brokerage firms found they could make more money hyping worthless mutual funds and internet, energy, and telecom stocks than they could by providing sound investment advice to their clients. Investment banks found it more profitable to dissolve their partnerships, become corporations, and speculate for their own account with investors' money than to provide underwriting and advisory services to their clients. (Bogle Galbraith Stewart Baker Kuttner Phillips)
All of this involved huge conflicts of interest between corporation and mutual fund managers and the shareholders these managers are supposed to serve, between accounting firms and the investing public accounting firms are supposed to serve, between brokerage firms and the investors brokerage firms are supposed to serve, and between investment banks and the corporations investment banks are supposed to serve. These conflicts of interest contributed directly to the Drexel Burnham Lambert, Charles Keating, Michael Milken, Ivan Boesky, and other insider trading, junk bond, and Savings and Loan frauds that were a direct cause of the junk bond and commercial real estate bubbles of the 1980s, the bursting of which was a precursor to the 1990-1991 recession. They also contributed directly to the HomeStore/AOL, Enron, Global Crossing, and WorldCom frauds that were a direct cause of the dotcom and telecom bubbles of the 1990s, the bursting of which led to the 2001 recession.
In addition, usury laws were repealed throughout the country, and credit card companies were allowed to charge exorbitant interest rates, exact unreasonable fees, and to manipulate payment dates and the dates at which payments were recorded to force customers to pay late charges even though payments were mailed and received on time. (PRIG) At the same time, credit card companies devised elaborate schemes to lure naive and financially unsophisticated customers deeper and deeper into debt. And in 2005 the Bankruptcy Abuse Prevention and Consumer Protection Act was passed which made it almost impossible for lower income people to discharge their credit card and other debts in bankruptcy. (Frontline MSN Warren Tabb Morgan Scott)
Antitrust laws were ignored throughout this entire period as corporations were allowed to merge into mega institutions with overwhelming economic and political power. Laws against interstate banking were repealed in 1994, and as the banking industry began to concentrate its power, two legislative acts removed key regulatory constraints on the financial system. The first was the Financial Services Modernization Act of 1999 (FSMA) which repealed the prohibition against commercial bank holding companies becoming conglomerates that provide both commercial and investment banking services along with insurance and brokerage services. The second was the Commodity Futures Modernization Act (CFMA) of 2000 which blocked attempts to regulate the derivatives markets.[2]
These changes made it possible to accumulate wealth in the 1980s, 1990s, and 2000s at levels that were heretofore unimaginable. Along with that wealth came unimaginable levels of economic and political power. Along with that power came a virtual collapse of integrity in our financial and political systems. In the wake of the dotcom and telecom bubbles bursting and the collapse of the HomeStore/AOL, Enron, Global Crossing, and WorldCom frauds, the mega banks and accounting firms that had facilitated these frauds found they could make hundreds of billions of dollars by securitizing subprime mortgages,[3] that is, by securitizing mortgages executed by borrowers who did not qualify for prime rate loans. This discovery set in motion a set of forces that drove our economic system—along with that of the entire world—headlong into a catastrophe of epic proportions.
Securitization and the Crash of 2008
Securitizing subprime mortgages became so profitable that by the early 2000s there were not enough qualified subprime borrowers to meet the demands of securitizers. Rather than cut back their operations, predatory mortgage originators (such as Washington Mutual, Countrywide, IndyMac, New Century, Fremont Investment & Loan, and CitiFinancial) talked millions of naive people into applying for subprime mortgages by misrepresenting the nature of these mortgages. The most serious misrepresentation was to offer borrowers an adjustable rate mortgage (ARM) with an unreasonably low teaser rate without explaining the effect on their monthly payment when the initial rate adjusted to the actual rate. Using this and other ploys, borrowers who qualified for modest subprime mortgages at reasonable subprime rates were talked into applying for adjustable-rate subprime mortgages with teaser rates that would reset in two or three years to rates they could not afford. Even borrowers who qualified for modest prime rate mortgages at reasonable prime rates were talked into applying for exorbitant subprime mortgages they could not afford when the rates reset. (Senate FCIC WSFC Spitzer)
Securitizers also turned to Alt-A borrowers, that is, borrowers who were able to secure mortgage loans with little or no verification of the asset, income, and employment status they reported on the applications for these loans. These no-doc loans, as they were called in the beginning, were soon to become known as NINJA loans—short for No Income, No Job, and no Assets—or just plain liar loans. At this point borrowers not qualified for any kind of mortgage at all were approved for mortgages, and real-estate speculators got into the act.
As housing prices rose, speculators discovered they could obtain Alt-A mortgages with little or no money down. As a result, a host of speculators took out Alt-A mortgages knowing that if the prices of their properties increased they would profit greatly, and if the prices of their properties went down they could walk away from these mortgages with little or no loss to themselves. When such financing was combined with fraudulently obtained appraisals, many speculators were able to walk away from their loans with a profit without making a single payment on their mortgage. (T2P Senate FCIC WSFC)
Next, in order to sell these mortgages it was necessary for mortgage originators to obtain appraisals of the underlying properties consistent with the values of the mortgages being originated. To obtain these appraisals, mortgage originators shopped around for appraisers who would write consistent appraisals and shunned appraisers who would not. This guaranteed rising incomes for appraisers who cooperated with the mortgage originators and falling incomes for those who did not. At the same time, some lenders set up in-house mortgage appraisal subsidiaries so as to guarantee the kinds of appraisals they wanted. The result was a systematic upward bias in real-estate appraisals, and, as the flow of funds into the real-estate sector increased, this led to a systematic upward bias in housing prices. (FCIC WSFC Mian)
Firms that securitize mortgages were the next link in the financial food chain that fed off the subprime and Alt-A mortgages. In order for investment banks and other firms that securitized mortgages to sell their Mortgage-Backed Securities (MBSs)[4] at the highest possible price, they had to receive the highest possible rating from a bond rating agency. To accomplish this, the securitizers followed the lead of the mortgage originators to steer their business to bond rating agencies that gave them the highest ratings and away from those that gave them lower ratings. In this way the companies that securitized mortgages were able to get the three major bond rating agencies (Moody’s, Standard and Poor’s, and Fitch) to give triple-A ratings to Mortgage-Backed Securities even though the rating agencies had no creditable basis on which to rate these securities.[5] (House FCIC WSFC)
From 2002 through 2007 literally millions of fraudulent obtained subprime and Alt-A mortgages provided the collateral for trillions of dollars of Mortgage-Backed Securities (MBSs) that were spread throughout the financial system of the entire world—as well as into banks, insurance companies, pension funds, money market funds, mutual funds, and institutional endowment funds at home. (T2P FCIC WSFC) In the meantime, hundreds of billions of dollars were paid out in salaries, bonuses, and dividends to those who participated in this fraudulent securitization process. Even the managers of the banks, insurance companies, and mutual and endowment funds that bought these toxic assets—and whose constituents eventually suffered losses as a result—were paid billions of dollars in real cash as their paper profits grew along with the housing bubble that had been facilitated by this fraud.
Huge fortunes were amassed as this process grew beyond all bounds of reason, and as the fraud grew in the subprime and Alt-A mortgage markets, the officials in control of the federal government during the Bush II administration did nothing to stop it. When state and local authorities complained to the federal government about the predatory lending practices in their communities, not only did the Federal Reserve—which had the absolute authority under the Home Ownership and Equity Protection Act (HOEPA) to stop these practices (Natter WSFC)—do nothing to clamp down on the predatory practices in the mortgage market, the Justice Department actually went to court to keep state and local authorities from regulating this market. (Spitzer FCIC WSFC) As a result, no restraints were placed on the fraud being perpetrated by the mortgage originators, securitizers, and bond rating agencies as the entire securitization process became corrupt.
The resulting housing bubble grew dramatically in the mid 2000s, and, as with all speculative bubbles, it was only a matter of time before it burst. By the time it did, $11 trillion worth of mortgages on residential properties with inflated prices were created that could not sustain their value. To make things worse, virtually all of the worst-of-the-worst mortgages—the fraudulently obtained subprime and Alt-A mortgages—were bundled into Mortgage-Backed Securities (MBSs) and sold all over the world, and over half of the triple-A rated MBSs ended up on the books of our own financial institutions—on the books of investment and commercial banks, money market funds, mutual funds, pension funds, endowment funds, and insurance companies throughout the country. (NYU)
As housing prices began to fall in 2006, the Mortgage-Backed Securities (MBSs) that were created while housing prices were driven up to unsustainable levels began to lose their value. The ensuing panic drove all of the major investment banks in our country (and many of the commercial banks as well) into insolvency. The Federal Reserve was forced to increased Reserve Bank Credit by over a trillion dollars before the resulting run on the financial system came to an end, and the federal government was forced to put up $700 billion in the Troubled Asset Relief Program (TARP) funds to keep the financial system from collapsing. In the meantime, the unemployment rate hit 10% in October of 2009; trillions of dollars in the wealth of homeowners, insurance companies, mutual funds, pension funds, and in 401(k)s evaporated, and the financial and international exchange systems of the entire world were destabilized as a worldwide economic crisis followed in the wake of this disaster. (Stiglitz NYU FCIC WSFC)
Speculative Bubbles and Economic Efficiency
The securitization of fraudulently obtained subprime and Alt-A mortgages in the early to mid 2000s was, undoubtedly, the greatest fraud in history, one that sent shockwaves throughout the entire world. Those who bought homes during the housing bubble facilitated by this fraud, whose pension plans were invested in the toxic assets created as a result of this bubble, who had a stake in the endowment and mutual funds that invested in these assets, the small investors with 401 (k)s, those who depended on wages and salaries for their livelihood and found themselves unemployed as a result of the economic collapse caused by the bursting of the housing bubble, and those who lost their homes as a result of the collapsing housing market and the recession that followed were particularly hard hit by the economic catastrophe that followed in the wake of this fraud. At the same time those who stood at the center of this fraud made fortunes. (Galbraith FCIC WSFC)
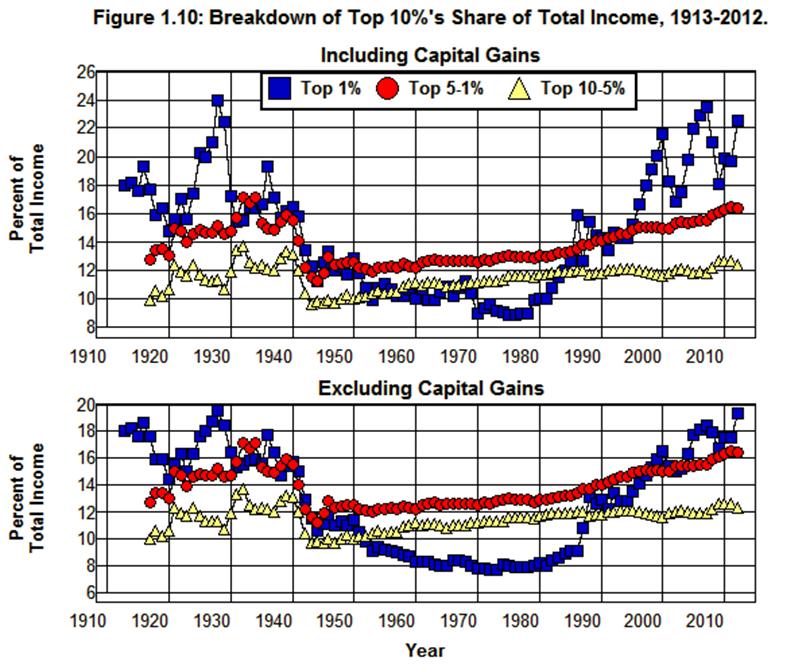
The same is true of the economic disasters that followed the hostile takeover/leverage buyout craze and the savings and loan fiasco of the 1980s and the dotcom and telecom bubbles of the late 1990s. Huge profits, bonuses, and windfall gains were generated as asset prices were bid up in the process of creating these speculative bubbles, and all of these bubbles were precursors to economic catastrophes. (Stewart FCIC WSFC Mian) The extent to which this is so is shown in Figure 1.10 through Figure 1.12.
Figure 1.10 provides a breakdown of the share of total income that went to the top 10% of the income distribution from 1913 through 2010. This graph shows the relative stability of the share of total income of the top 90-99% of the income distribution since1945 compared to that of the Top 1%. It also shows the volatility of the share of total income that went to the Top 1% before 1945 and after 1980 compared to the relative stability of the share this group received in the period of restrictive financial regulation from 1945 to 1980. Of particular interest is the way in which the volatility of the Top 1% is tied to speculative bubbles.
Source: The World Top Incomes Database.
The extent to which the Top 1% of the income distribution benefited from these bubbles is clearly shown in Figure 1.10 by
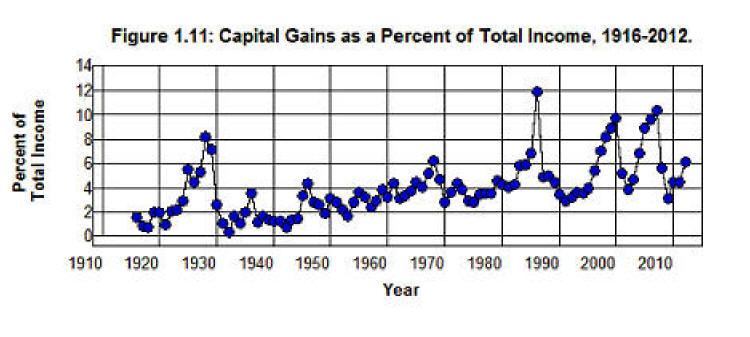
Similarly, Figure 1.11 shows the amount of income received in the form of capital gains as a percent of total income from 1916 through 2012. This figure displays a pattern similar to that in Figure 1.10 with relatively little volatility in the percent of total income received in the form of capital gains during the period of restrictive financial regulation from 1945 to 1980 compared to the preceding and following periods. While the 1986 spike in this graph conflates the effects of the anticipated 1987 increase in the capital gains tax with the effects of the junk bond and commercial real estate bubbles of the 1980s, there were no capital gains tax increases in the 1920s, 1990s, or 2000s.
Source: The World Top Incomes Database.
The increase in capital gains by fully 6% of total income in the 1920s, 1990s, and 2000s depicted in Figure 1.11 clearly shows the effects of speculation on income during these eras that led to economic catastrophes as those who profited from these bubbles realized huge capital gains—and it is worth emphasizing here that these are realized capital gains. When the crash came there was someone or some institution on the other side of the sale that generated these realized capital gains that realized the loss including pension funds, insurance companies, 401(k)s, endowment funds, and taxpayers when depositors and financial institutions were bailed out.
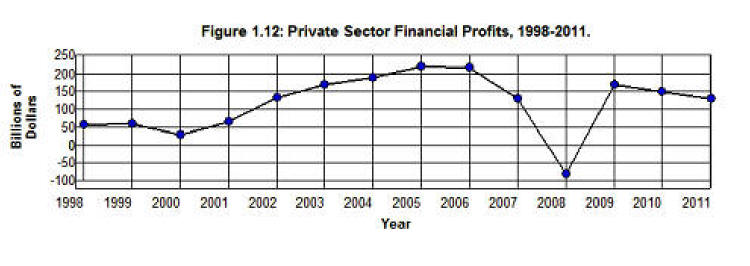
While Figure 1.10 and Figure 1.11 deal with household and family incomes, Figure 1.12 shows how the financial system fared through the housing bubble of the 2000s.
Source: Bureau of Economic Analysis (6.17D 1.1.5 1.5.4).
Of particular interest in Figure 1.12 is the 173% increase in Private Sector Financial Profits from 1998 to 2005 following passage of the Financial Services Modernization Act of 1999 (FSMA) and the Commodity Futures Modernization Act of 2000 (CFMA). These two acts, combined with the refusal by the Bush II administration and the Greenspan Federal Reserve to enforce what little financial regulation remained, gave the non-depository financial institutions a free hand to do just about whatever they wanted to do in the world of finance. What they wanted to do was securitize millions of fraudulently obtained subprime and Alt-A mortgages and sell those mortgages all over the world. In the process they managed to accumulate over $700 billion dollars in profits from 2001 through 2007 in excess of what they would have made if there had been no housing bubble and their profits had stayed at their 1998 level. And it is worth noting here that in 1998 we were in the midst of the dotcom and telecom bubbles, and financial profits were already at a record high.
Deregulation of the financial markets was done in the name of economic efficiency, but the massive fortunes made in the process of creating the dotcom, telecom, and housing bubbles had nothing to do with economic efficiency. Nor were there economic efficiencies gained in the fortunes made in the junk bond and commercial real estate bubbles created during the savings and loan fiasco or in the leverage buyout/hostile takeover craze of the 1980s. These fortunes were amassed in the process of squandering our economic resources on a massive scale as companies were driven dangerously into debt through leveraged buyouts and hostile takeovers or in attempting to avoid such takeovers; funds were directed into sham internet companies, and resources were directed into the production of redundant telecom facilities and innumerable real-estate projects that sat empty as the bubbles burst and millions of people lost their jobs, their homes, their pensions, their life savings, and their hopes and dreams for the future in the wake of the economic catastrophes that followed.
Economic efficiency means maximizing the amount of output produced with given amounts of resources toward the end of improving human well-being. It’s not about transferring income and wealth from the bottom of the income distribution to the top. This transfer of income and wealth may seem efficient from the perspective of those at the top. It is clearly not efficient from the perspective of the vast majority of the population at the bottom. The suggestion that the policy changes that have occurred over the past forty years—policy changes that led to a collapse of the fiduciary structure of society, gave rise to massive frauds, generated massive rewards for those who perpetrated these frauds, and harmed the vast majority of the population to the benefit of the few—have somehow improved the economic efficiency of the American economy is absurd.
Over 8 million people had lost their jobs by 2010 as a result of the housing bubble bursting in 2006, and 4 million families lost their homes. In 2010, another 4.5 million families were seriously behind in their mortgage payment or in the process of foreclosure. “In the fall of 2010, 1 in every 11 outstanding residential mortgage loans in the United States was at least one payment past due but not yet in foreclosure.” Nationwide, 10.8 million families—22.5% of all families with mortgages—owed more on their mortgages in 2010 than their houses were worth. In Florida, Michigan, and Nevada more than 50% of all mortgages were underwater, and it is projected that by the time this crisis is over as many as 13 million families could lose their homes. (FCIC)
These numbers are the end result of the economic policy changes we have made over the past forty years, and there’s nothing efficient about them.
Chapter 1: Income, Fraud, Instability, and Efficiency
Changes in the Distribution of Income
The Rise of Predatory Finance and Corruption
Securitization and the Crash of 2008
Speculative Bubbles and Economic Efficiency
Chapter 2: International Finance and Trade
International Crises and Financial Bailouts
The Overvalued Dollar and International Trade
The Overvalued Dollar and International Debt
Appendix on International Exchange
Chapter 3: Mass Production, Income, Exports, and Debt
What Financial Institutions Do
Those Who Cannot Remember the Past
Chapter 5: Nineteenth Century Financial Crises
First and Second Banks of the U. S.
National Banking Acts of 1863 and 1864
Solvency, Liquidity, and Banks
Failings of the National Banking System
Chapter 6: The Federal Reserve and Financial Regulation
Controlling the Amount of Currency
Controlling Loans and Deposits
Roaring Twenties and Great Depression
The Dynamics of Financial Instability
Chapter 7: Rise of the Shadow Banking System
Financial Innovation in the 1970s
Importance of Collateralization
Appendix on Financial Markets and Instruments
Chapter 8: Mortgages, Derivatives, and Leverage
Credit Default Swaps and Synthetic CDOs
Shadow Banks, Derivatives, and Systemic Risk
Chapter 9: LTCM and the Panic of 1998
Chapter 11: Lessons from the Great Depression
Chapter 12: Coming to Grips with Reality
Lower Taxes, Less Government, and Deregulation
Reregulating the Financial System
Reregulating International Exchange
Reregulating Collective Bargaining
End Notes
[1] The reason for the stability from the end of World War II through the 1970s and why this changed in the 1980s is examined in detail in Chapter 5 through Chapter 7 below.
[2] The reasons for the need to regulate the markets for derivatives are examined in detail in Chapter 8.
[3] The basic mechanism by which securitization is accomplished is examined in detail in Chapter 8 below. For an in-depth explanation of securitization that is quite readable see the Financial Crisis Inquiry Commission’s Preliminary Staff Report Securitization and the Mortgage Crisis.
[4] Mortgage-Backed Securities are explained in detail in Chapter 8.
[5] In a case study of Moody’s Investors Service the Financial Crisis Inquiry Commission’s Report concluded:
The three credit rating agencies were key enablers of the financial meltdown. The mortgage-related securities at the heart of the crisis could not have been marketed and sold without their seal of approval. Investors re- lied on them, often blindly. In some cases, they were obligated to use them, or regulatory capital standards were hinged on them. This crisis could not have happened without the rating agencies. Their ratings helped the market soar and their down- grades through 2007 and 2008 wreaked havoc across markets and firms.
From 2000 to 2007, Moody’s rated nearly 45,000 mortgage-related securities as triple-A. This compares with six private-sector companies in the United States that carried this coveted rating in early 2010. In 2006 alone, Moody’s put its triple-A stamp of approval on 30 mortgage-related securities every working day. The results were disastrous: 83% of the mortgage securities rated triple-A that year ultimately were downgraded.
You will also read about the forces at work behind the breakdowns at Moody’s, including the flawed computer models, the pressure from financial firms that paid for the ratings, the relentless drive for market share, the lack of resources to do the job despite record profits, and the absence of meaningful public oversight. And you will see that without the active participation of the rating agencies, the market for mort-gage-related securities could not have been what it became.