![]()
![]()
![]()
![]()
![]()
![]()
Chapter 3: Mass Production, Income, Exports, and Debt
The history of economic development over the past four-hundred years has been one of ever increasing output throughout the industrialized world as productivity increases in transportation, agriculture, textiles, steel, manufacturing, and, in today's world, automation, communication, and information technologies have been made possible through specialization, the division of labor, and the development of mass-production technologies.
The concept of interchangeable parts along with technological advances in the machine-tool, steel, and transportation industries combined with the use of assembly-line techniques and the development of electrical power and other utilities have led to an explosion in manufacturing since the beginning of the twentieth century. Automobiles, airplanes, farm and industrial equipment, construction materials, electronic equipment, home appliances, power tools, medical equipment and supplies, drugs, furniture, clothing, meat packing, fast foods, canned goods and other processed foods—virtually all of the goods the vast majority of the people spend the bulk of their incomes on today and many of the services, such as big-box retail, financial, and distribution services, as well—have proved to be amenable to the mass-production techniques that were developed or refined in the last century.
The process of technological advance and the development of mass-production techniques holds the potential for dramatic improvements in the economic wellbeing of the world’s population as ever greater quantities of goods can be produced with ever smaller amounts of human effort, but there is a catch: In order to be economically viable, mass-production techniques require mass markets—that is, markets with large numbers of people who have purchasing power. Otherwise, the mass quantities of goods and services that can be produced via mass-production techniques cannot be sold. The existence of mass markets within a society, in turn, depends crucially on the distribution of income within that society: The less concentrated the distribution of income, the greater the purchasing power out of income of large numbers of people, the larger the domestic mass market will be; the more concentrated the distribution of income, the smaller the purchasing power out of income of large numbers of people, the smaller the domestic mass market will be.
This brings us to the crux of the problem endemic in the changes in the distribution of income that have taken place during the past thirty-five years. Namely, that the share of income that went to the top 1% of the income distribution in the 2000s was twice what it was in the 1960s and 1970s. Doubling the income share of the top 1% from approximately 8% in 1980 to 19% in 2012 means the share of the bottom 99% went from 92% to 81%. As a result, the bottom 99% of the income distribution—99 out of 100 families—had, on average, 12% less purchasing power from income relative to the output produced in 2012 than the bottom 99% had relative to the output produced in 1980, and as we go down the income scale the reduction in purchasing power from income becomes more dramatic. The World Top Incomes Database shows that the fall in income for the bottom 90% of the income distribution in the United States from 1980 to 2012 was 23%. This means that in 2012 the bottom 90% of the population—9 out of 10 families—had, on average, 23% less purchasing power from income relative to the output produced in 2012 than the bottom 90% had in 1980 relative to the output produced in 1980.
Exports and Imports
In addition to the decrease in domestic purchasing power from income relative to the output produced experienced by the vast majority of the population since 1980, a substantial portion of the remaining purchasing power generated through the production of goods and services in our economy has been siphoned off by an increase in imports relative to exports.
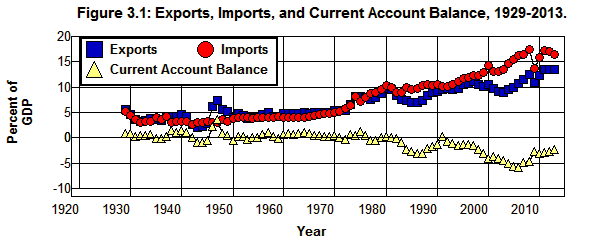
As can be seen in Figure 3.1, until 1983 the United States Current Account Balance barely exceeded 1% of GDP other than in the aftermath of World War II. As a result, changes in imports and exports played a relatively minor role in the development of mass-production markets in the United States throughout most of the twentieth century. [14] This changed after 1982 as our current account deficit (i.e., negative Current Account Balance) grew. While exports remained essentially unchanged from 1980 through 2007, going from 9.8% to 11.5% of GDP, imports increased from 10.3% to 16.4% of GDP. As a result, our Current Account Balance went from a 0.3% of GDP surplus to a 4.8% deficit.
Source: Bureau of Economic Analysis (4.1 1.1.5)
One would expect this kind of change, when combined with the increased concentration of income, to have a disruptive effect on employment and output in our mass-production industries as prices and profits fell in those areas that compete with imports and serve mass markets. But even though the deficit in our Current Account Balance has had a devastating effect in the manufacturing sector of our economy as the decline in the rust-belt states can attest, and in spite of three minor recessions we experienced from 1980 through 2006, unemployment trended downward over the period as employment and productivity rose. At the same time, mass market retailers such as Wal-Mart and Home Depot seem to have thrived.
It is demand—either in domestic markets or in foreign markets—that creates its own supply in a mass-production economy, not the other way around, and the purchasing power necessary to maintain our domestic mass markets and employment had to come from somewhere from 1980 through 2006 as the incomes of the vast majority of the population fell relative to the ability to produce and imports rose relative to exports. Since the ability to service our mass markets out of income was reduced for the vast majority of the population during this period, the only place from which the purchasing power necessary to maintain our domestic mass-markets and employment could have come was through the transfer of purchasing power from those whose purchasing power out of income was increasing during this period to the vast majority of the population that was losing purchasing power out of income. This is especially so in view of the almost continuous increase in productivity that occurred since 1980.
The primary mechanism by which purchasing power out of income is transferred from those who have it and do not wish to spend to those who do not have it and do wish to spend is through the creation of debt—that is, by those who have purchasing power lending their excess purchasing power to those who are willing to borrow in order to use it.[15] To the extent borrowed money is used to purchase newly produced goods and services that would otherwise not have been purchased, the resulting increase in debt leads to an increase in the demand for goods and services. In so doing, increasing debt provides a mechanism by which it is possible to maintain mass markets and full employment as productivity increases, income becomes more concentrated, and imports increase relative to exports without the need for prices to adjust to redistribute income or for exchange rates to adjust to reduce imports relative to exports. [16]
The point is, given the state of mass-production technology within our society, the domestic markets necessary to support full employment could not have been maintained without an increase in debt as the income transfer to the top of the income distribution examined in Chapter 1 took place and, thus, diluted the purchasing power out of income of the rest of the population relative to the output produced.[17] This is especially so as the situation was made worse as imports of mass produced goods increased relative to exports and productivity increased. Since employment, output, and productivity all increased during this period, it should not be surprising to find that debt increased substantially as well.
100 Years of Income and Debt
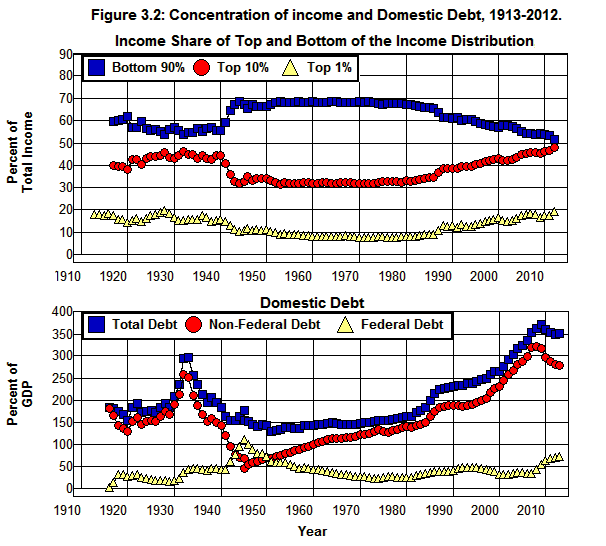
The dramatic changes that have occurred in the concentration of income and the growth in debt since the beginning of the twentieth century are shown in Figure 3.2 which plots the income share received by the Bottom 90%, Top 10%, and Top 1% of the income distribution from 1913 through 2012 as well as Total Debt, Non-Federal Debt, and Federal Debt outstanding in the United States from 1916 through 2013. These changes had profound effects on the development of our mass markets and the utilization of mass-production technologies within the economic system throughout the twentieth century. They also had profound effects on economic instability.
Source: The World Top Incomes Database, Federal Reserve (L1), Historical Statistics of the U.S. (Cj870,Cj872 Ca10), Bureau of Economic Analysis (1.1.5).
Turn of the Century through the Great Depression
The expansion of mass-production technologies undoubtedly received a huge boost from the increase in Exports and the expansion of Federal Debt that accompanied the 1914 outbreak of World War I. That boost proved unsustainable, however, as the economy entered the 1920-1921 recession at war's end. This recession was followed by a speculative bubble in the real-estate market that was superseded by a speculative bubble in the stock market. As can be seen in Figure 3.2, these two bubbles were accompanied by an increase in both debt and the concentration of income as Total Debt went from 156% of GDP in 1920 to 192% in 1928, and the income share received by the Top 1% went from 14.5% of total income (excluding capital gains) to 19.6% in those eight years. At the same time, the share that went to the Top 10% increased from 38% to 46%. As a result, the income share of the Bottom 90% fell from 62% of total income to 54% by 1928.
The expansion of debt that offset the concentration of income in the 1920s not only allowed the markets for mass-produced goods to grow with the economy during the decade, as we will see in Chapter 4, it also made these markets increasingly vulnerable to an economic downturn. In the process it undermined the stability of the financial system. As a result, when the economic downturn began in the summer of 1929, and the stock market crashed in the fall of that year, the financial system began to founder.[19] The absence of federal deposit insurance combined with an unwillingness (or inability) of the Federal Reserve to prop up the banking system led to a run on the system in the fall of 1930 that caused the financial system to implode. This worsened the economic downturn as the economy spiraled downward from 1929 through 1933. (Meltzer, Friedman and Schwartz, Fisher, Skidelsky Eichengreen Kindleberger Mian)
The phenomenal fall in prices, wages, output, and income that resulted caused Total Debt as percent of GDP to increase from 184% of GDP in 1929 to 295% by 1933. As we will see in Chapter 11, this dramatic increase in the debt ratio was caused by a 45% decrease in GDP that occurred during this period, rather than by an increase in debt. Total debt actually fell by 12% from 1929 through 1933. In the meantime, over 10,000 banks and savings institutions failed along with 129,000 other businesses; the unemployment rate soared to 25% of the labor force as 12 million people found themselves unemployed by the time the downward spiral of the economy came to an end in 1933.
This 295% debt ratio was, of course, unsustainable, and a substantial deleveraging of the system took place as Total Debt as a percent of GDP fell from 295% in 1933 to 184% by 1940. As we will see, again in Chapter 11, this deleveraging took place through an increase in GDP as unemployment fell and output and prices increased rather than through a fall in the debt itself which actually increased somewhat during this period.
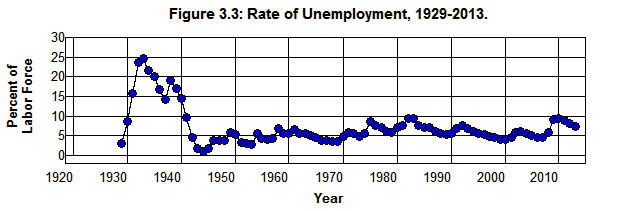
Even though GDP managed to increase by 80% from 1933 through 1940 this was insufficient to restore the mass markets necessary to bring the system back to full employment before 1942. Even though Federal Debt more than doubled, and even though the income share at the Top 1% fell substantially from its 1928 high of 19.6%, it remained above 15% in all but one year during the 1930s. At the same time, the income share of the Top 10% remained essentially unchanged throughout the entire period averaging 44% of total income with a high of 46% in 1928 and a low of 43% in 1938. As a result, the rate of unemployment remained above 14% for the entire decade following 1930 and, as is shown in Figure 3.3, did not fall below 10% until 1941.
Source: Bureau of Labor Statistics (1), Economic Report of the President, 1966 (D17).
World War II and its Immediate Aftermath
The decade of the 1940s was dominated by World War II as the federal government took over the economy. Not a single automobile was produced in the United States from early in 1942 through 1945, and production of other consumer durable goods was suspended as well. Government mandated wage and price controls were instituted, and consumer goods were rationed as every effort was made to direct our economic resources into the production of war materials. The huge increases in government expenditures this entailed, combined with the extraordinary increase in the size of the military, brought the economy to near full employment in 1942 and to extraordinarily low levels of unemployment from 1943 through 1945. In addition, taxes were increased substantially as the top marginal income tax rate was eventually set at 94%. (Kennedy)
In spite of the dramatic increase in Federal Debt during the war—from 44% of GDP in 1941 to 111% by 1945—Total Debt as a percent of GDP hardly increased as it went from 163% to 178%. This feat was accomplished through a huge deleveraging of the non-federal sector of the economy as wage and price controls and rationing combined with the tremendous increase in production, hence, income, made it possible for the ratio of Non-Federal Debt to GDP to fall from 120% of GDP in 1941 to 67% by 1945.
In addition, the concentration of income fell dramatically during the 1940s, from 16% of total income that went to the Top 1% in 1940 to 11% in 1950, and the income share that went to the Top 10% went from 44% to 34%. The concentration of income continued to fall during the 1950s and 1960s reaching a low point in 1973 of 7.7% of total income for the Top 1% and 32% for the Top 10%. As a result, the purchasing power of the Bottom 90% of the income distribution increased from 56% of total income in 1940 to 68% by 1973.
The Great Prosperity
The period from 1950 through 1973 has been dubbed The Great Prosperity by Robert Reich. It was, indeed, a prosperous time. The economy did not suffer the fate at the end of World War II that it suffered at the end of World War I. A massive demobilization took place as our factories retooled from the mass production of war materials to the mass production of civilian goods, and millions of service men and women were discharged from the military, but there was no major recession, and, as can be seen in Figure 3.3, unemployment remained below 6% for twelve years following World War II and below 7% until 1975.
The fact that Europe and Asia were devastated by the war aided the transition to a peacetime economy in that the need to rebuild the war-torn countries caused Exports (Figure 3.1) to remain high during the four years following the war. At the same time, government policies, such as the GI Bill, helped to ease the transition from military to civilian life for millions of veterans as they mustered out of the service.
Federal Debt decreased almost continuously relative to GDP following World War II, from a 1945 high of 111% of GDP to its post-war low of 23% of GDP in 1974—a fall of 88 percentage points. Total debt, on the other hand, increased gradually relative to GDP from 1951 through 1980, going from 129% of GDP to 165%. The reason is, Non-Federal debt went from 67% of GDP in 1951 to 139% by 1980—a 72 percentage point increase that more than offset the 44 percentage point fall in Federal Debt.
While there was a relatively large increase in Non-Federal Debt in the 1950s and 1960s, that debt was sustainable in that it was not backed by investments based on speculative bubbles or on consumers’ incomes created by speculative bubbles. It was backed by profitable investments both in the private and public sectors of the economy—investments in private capital and public infrastructure that increased productivity sufficiently to be self financing—and by consumers’ incomes that were derived from the employment created by those profitable investments.
The financial regulatory system put in place in the 1930s (discussed in Chapter 6 below) and the fall in the concentration of income throughout the 1950s and 1960s made it possible for domestic mass markets to grow with the economy in such a way as to support the increases in mass production and productivity that took place during this period with relatively full employment and without an expansion of exports relative to imports. As a result, the domestic economy was able to grow and the vast majority of the population was able to prosper without creating the kinds of speculative bubbles that led to the economic catastrophe of the 1930s even though the expansion of domestic mass markets was aided by an expansion of debt. That this is so is indicated by the fact that there were no major financial crises that required a government bailout to keep the financial system from imploding during this period.
The Great Inflation
The latter half of the 1960s through the first half of the 1980s—an era dubbed The Great Inflation by Allen Meltzer—presented a unique challenge to policy makers. From 1952 through 1965 the effective annual rate of inflation (as measured by the GDP deflator) was 1.72%. From 1965 through 1984 it was 5.96%, and from 1975 through 1981 it was 7.66%. Efforts to end the inflation along with the 1973 Arab oil embargo and the concomitant quadrupling of the price of oil led to a number of shocks to the economic system. The turmoil of the times was reflected in a sharp fall in the growth of output in 1967 and a series of recessions that occurred in 1970, 1973-1975, 1980, and 1981.
The rise in interest rates combined with the 1980 and 1981 recessions that resulted from the efforts by the Federal Reserve to bring the inflation to an end left thrift institutions in desperate straits, but this did not pose a serious threat to the economic system itself. The existence of federal deposit insurance made it possible to avoid a run on these institutions (there was no federal deposit insurance in 1930) and this allowed time to resolve the problem in an orderly way. The real threat to the system came from the changes in economic policies that took place in the 1980s in response to the problems caused by inflation and the energy crisis of the 1970s.
Reagan's Revolution
The results of the policy shift that took place in the 1980s are reflected in Figure 3.2 by the increase in Total Debt as a percent of GDP from 164% in 1981 to 231% by 1990 as the ratio of Federal Debt to GDP increased by 16% of GDP and that of Non-Federal Debt by 51% of GDP. The 67 percentage point increase in Total Debt that took place during the 1980s was six times the average for the previous three decades, and it helped to fuel the junk bond and commercial real estate bubbles that brought on the Savings and Loan Crisis in the 1980s.
What is of particular interest here, however, is how the increase in debt made it possible for unemployment to trend downward over the decade in spite of the fact that the income share that went to the Top 10% of the income distribution went from 33% of total income in 1980 to 39% by 1990. In other words, this increase in debt made it possible for unemployment to trend downward over the decade in spite of the fact that the purchasing power out of the income received by the Bottom 90% of the income distribution fell from 67% to 61% of total income.
The Go-Go 1990s
The 1990s began with a minor recession as the unemployment rate reached 7.5% of the labor force in 1992, up from 5.3% in 1989. Income concentration was fairly stable from 1988 through the first half of the 1990s as the share of the Top 10% went from 39% in 1988 to 40% in 1994 and of the Top 1% from 13.2% to 12.9%. Following 1994, however, there was a significant increase in concentration as the share that went to the Top 10% reached 43% by 2000 and the Top 1% reached 16.5%. This was about where the distribution of income had been when speculative bubbles in the real-estate and stock markets fueled the economy through the roaring twenties and during the 1930s when the lack of speculative bubbles led to economic stagnation through the Great Depression.
There was some deleveraging that took place in the non-federal sector of the economy in the first two years of the 1990s, and then Non-Federal Debt continued upward at a steady pace. Federal Debt peaked at 49% of GDP in 1993 and declined to 39% of GDP by 2001 as Total Debt went from 231% of GDP in 1990 to 265% by 2000. At the same time, there was a substantial increase in imports relative to exports as the deficit in our Current Account went from 1.3% to 4.0% of GDP. (Figure 3.1) In addition, productivity increased dramatically as the average increase in output per hour during the last half of the 1990s was almost twice that of the average increase for the previous ten years.
All of these factors would have made it difficult to maintain the domestic mass markets needed for full employment in the absence of the 33 percentage-point increase in Total Debt that took place during that period as the rate of unemployment fell from 7.5% in 1992 to 4.0% in 2000. It helped that, unlike the situation in 1980s, there was, in fact, a significant increase in the average real income that went to the Bottom 90% of the income distribution from 1993 through 2000 in spite of the increase in the concentration of income at the top, but the largest economic stimulus came from the dotcom and telecom bubbles that began in the mid 1990s.
Financial wealth more than tripled in the five years from 1995 through 2000. The NASDAQ Composite Index went from a low of 791 in 1995 to a high of 5048 in 2000 as the Standard & Poor's 500 Index went from 501 to 1527. In the process, this increase in the value of stocks decreased the cost of equity capital for corporations, and, thereby, lowered the cost of financing investment through equity relative to the cost of financing investment through debt. At the same time, the fact that realized capital gains steadily rose from 3.0% of total income in 1995 to 9.7% in 2000 made it possible for many to increase their consumption or investment expenditures without having to rely on debt. Both of these factors would tend to bolster domestic mass markets by offsetting the effects of increasing imports and income concentration without the need to increase debt. In any event, times seemed prosperous after 1995 until the stock market crashed in March of 2000, and the trillions of dollars of illusory wealth that had been created by the dotcom and telecom bubbles disappeared.
Even though hundreds of billions of dollars had been wasted in the development of worthless dotcom companies such as Webvan.com, Pets.com, and Flooz.com and in companies such as Enron, Global Crossing, and WorldCom there was not a collapse in the financial system when the dotcom and telecom bubbles burst comparable to what had taken place following the Crash of 1929. What was different about the increase in paper wealth generated by the bubbles in the latter half of the 1990s is that, unlike the 1920s and in spite of the fact that Total Debt had increased significantly leading up to the crash, the dotcom and telecom bubbles were not financed directly through an excessive buildup of debt collateralized by stocks. (Mian) The reason is that since the Securities Exchange Act of 1934, the Federal Reserve has had the power to set the margin requirement on loans collateralized by stocks, that is, has had the power to set the minimum down payment a buyer must put up when borrowing money to buy stocks. The margin requirement was 50% during the 1990s which limited the amount of money speculators could borrow using stocks as collateral to 50% of the value of the stock. In the 1920s, the margin was as low as 10% in the unregulated markets of the times which allowed speculators to borrow as much as 90% of the purchase price when purchasing stock.
Even though the Federal Reserve refused to increase the margin requirement to keep the speculative bubble in the stock market from growing during the 1990s, the existence of a 50% margin requirement on loans collateralized by stocks minimized the damage caused by the dotcom and telecom bubbles bursting. As a result, few defaulted on their loans when these bubbles burst, and there was not a wave of distress selling of assets which, as we will see in Chapter 4 and Chapter 7, had occurred following the Crash of 1929. While tens of millions of people were adversely affected as trillions of dollars of wealth evaporated into thin air, the financial system remained intact, and the economic system survived fairly well. There was a relatively minor economic downturn as unemployment increased from 4% of the labor force in 2000 to 6% by 2003, but since there were no insured deposits involved, there was no government bailout of depositors with taxpayers' money as there had been in the savings and loan debacle of the 1980s although the federal Pension Benefit Guarantee Corporation insurance program did take a hit.
Then came the speculative bubble in the housing market brought on by the unregulated securitization of subprime mortgages. Unlike the stock-market bubble of the 1990s, the housing-market bubble of the 2000s was financed directly through an excessive buildup of debt collateralized by mortgages.
Unregulated Finance in the 2000s
Following passage of the Financial Services Modernization Act (FSMA) in 1999 and the Commodity Futures Modernization Act (CFMA) in 2000, the era of unregulated finance reached its pinnacle in the first half of the first decade of the twentieth-first century. It was an era of abiding faith in the ability of freewheeling capitalism to solve our economic problems based on the conviction that unfettered markets would allocate resources in the most efficient manner. This freedom from regulation was supposed to bring economic prosperity to all. As it turned out, it didn’t. Instead, as is shown in Figure 3.1 and Figure 3.2, the cowboy finance that resulted led to dramatic increases in Imports, a further concentration of income, and a dramatic increase in debt.
The income share of the Top 10% and Top 1% fell from 43% and 16.5% in 2000 to 42% and 15.0% in 2002 (Figure 3.2) as the recession took its toll, and then increased to 46% and 18.3% of total income by 2007—about where they had peaked 1928. At the same time, imports increased relative to exports as the deficit in our Current Account went from 4.0% to 4.9% of GDP (Figure 3.1), and Total Debt increased continuously from 2000 through 2008 from 265% to 364% of GDP (Figure 3.2)—an 89 percentage point increase in just seven years.
At this point Total Debt as a percent of GDP was excessive even by the standard set in 1933 after GDP had fallen by 40% from its 1929 high.[20] By 2008 the GDP stood at $14.7 trillion and the Total debt at $53.6 trillion!
Why the System Collapsed
Servicing a debt of $53.6 trillion out of an income of $14.7 trillion places a huge burden on the system through the transfer of income from debtors to creditors. Even an average interest rate as low as 3% would require an annual transfer equal to 11% of GDP when total debt is as high as 364% of GDP as it was in 2008. An average interest rate of 5% would require an annual transfer equal to 18% of GDP. In terms of real money, a 3% average rate of interest on the total debt of $53.6 trillion that existed in 2008 would have required that $1.5 trillion/year be transferred from debtors to creditors. A 5% average rate of interest would have required a $2.68 trillion/year transfer—$156 billion more than the total of $2.57 trillion the federal government collected in taxes in 2008!
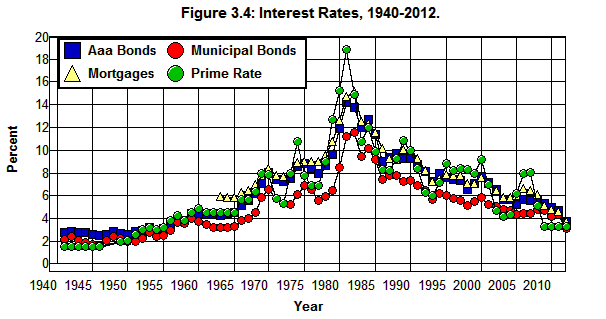
Figure 3.4 shows the interest rates paid on triple-A rated corporate bonds (AAA Bonds), Municipal Bonds, conventional Mortgages, and Prime Rate loans from 1940 through 2012.
Source: Economic Report of the President, 2013 (B73PDF|XLS)
The graphs in this figure indicate that interest rates in the early 2000s were comparable to those in the 1960s when Total Debt was less than 150% of GDP. Even more important is the fact that Non-Federal Debt had risen to 321% of GDP by 2008. Unlike the federal government (which has the constitutional right to print money) those entities that make up the non-federal sector of the economy—whether they are individuals, businesses, financial institutions, or municipal governments—must service their debts out of income. When they cannot service their debts out of income they must refinance. Barring the ability to refinance, the only option to which they can turn is to the dreaded distress selling of assets or to default on their financial obligations—the kind of selling of assets and defaults that, as we will see in Chapter 4 through Chapter 6, lead to financial crises. (Minsky)
Non-federal debt of this magnitude makes the economic system extremely fragile, and when much of that debt is the product of financing a speculative bubble and backed by assets and incomes generated by that bubble the situation is even worse. It should be no surprise that in the face of the debt that existed in the mid 2000s it was the upturn in interest rates in 2005 and 2006 caused by the Federal Reserve's attempt to moderate the housing boom without actually having to regulate the mortgage market that brought the housing bubble to an end in 2006 and sent shockwaves through the financial system in 2007.
It should also be no surprise that the bursting of the housing bubble in the United States reverberated throughout the rest of the world. As was noted at the beginning of Chapter 1, the economic policies that led to the deregulation of our financial system at home were not an exclusively American phenomenon. They had been promulgated all over the world by institutions such as the International Monetary Fund in the name of the now infamous Washington Consensus. (Klein) The result was not only financial deregulation and a housing bubble in the United States financed by expanding debt, but in many countries in Europe and elsewhere around the world as well. As a result, the crisis that began in the American financial system in 2008 was destined to create a worldwide economic catastrophe.
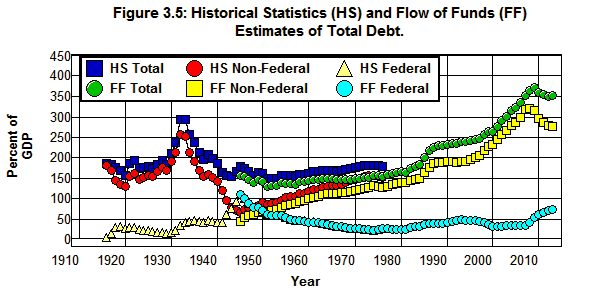
Appendix on Estimating Debt
The Historical Statistics of the U.S. (Cj872 Ca10) provide estimates of total debt from 1916 through 1976, and the Federal Reserve's Federal Reserve's Flow of Funds Accounts (L1) provides estimates of total debt from 1945 through 2013, but the two series are only roughly comparable. For the thirty-one years in which they overlap, the Federal Reserve's estimates as a percent of GDP are systematically below the Historical Statistic's estimates by an average of 12%. Both sets of data are plotted individually in Figure 3.5.
Source: Federal Reserve (L1), Historical Statistics of the U.S. (Cj870,Cj872 Ca10), Bureau of Economic Analysis (1.1.5).
In constructing Figure 3.2, the Historical Statistics' estimates were used to estimate Total Debt from 1900 through 1945 and the Flow of Funds' estimates were used from 1945 through 2012. The estimates from both sources are plotted for the year 1945, hence, the two points in the Total Debt and Non-Federal Debt curves in Figure 3.2 where Non-Federal Debt is obtained by subtracting Federal Debt from Total Debt in this figure. There was no need to make an adjustment in the Federal Debt and GDP series used in constructing this figure as the differences in the estimates provided by the Historical Statistics of the U.S. (Cj872) and Bureau of Economic Analysis (1.1.5) in the years they overlap are insignificant.
When comparisons are made in the text between 1945 and years prior to 1945 the Historical Statistics value for 1945 are used, and the Flow of Funds value are used when comparing 1945 and years following 1945.
Endnotes
[14] The way in which our Current Account Balance is determined and its relationship to imports and exports is explained in detail in the Appendix on International Exchange at the end of Chapter 2.
[15] It should be noted that purchasing power can also transferred through the purchase of newly issued equities (i.e., corporate stock). This mechanism plays a very important role in transferring purchasing power within the economic system, and was particularly important during the stock market bubble in the 1990s and, most definitely, in the 1920s. In normal times, however, newly issued debts are, generally, quite a bit larger than newly issued equities, and equities do not pose the same kind of systemic risk posed by debts. Since there are no contractual payments associated with equities comparable to the interest and principle obligations associated with debt, except to the extent the purchase of equities is financed through debt, there is no risk of default associated with newly issued equities. The systemic risk associated with debt and the nature of various kinds of financial market instruments are discussed in Chapter 4, Chapter 7, and Chapter 8.
[16] The idea that prices must adjust to redistribute income in the absence of an increase in debt in this situation may seem unorthodox to some economists, but the need for redistribution is, in fact, implicit within the standard competitive model that lies at the core of Neoclassical Economics. Wages and prices are simply assumed to adjust automatically to redistribute income in this model and long-run economic profits are assumed to be competed away. As a result, there is no unemployment problem in this mode. In the real world, of course, prices do not adjust automatically to redistribute income and economic profits do not get competed away. Thus there is no reason to believe that the economy will be able to remain at full employment as the concentration of income increases and economic profits accumulate in the real world.
It should also be noted that since the neoclassical model is typically presented in terms of a system of equations derived from the optimizing behavior of a representative household and a representative firm, the distribution of income is not explained in this model nor is the distribution of technology. Only the income of the representative household is explained by way of the assumption that the amount of income the representative household receives is determined by the quantities of productive resources it owns and the prices these resources are able to command in the marketplace, and only the technology embodied in production function of the representative firm is considered.
But the assumption that income is determined by the ownership of productive resources, in turn, implies that the distribution of income is ultimately determined by the distribution of wealth among households. This means that to examine how the distribution of income affects the economic system we must go beyond the system of equations that are derived from the optimizing behavior of the representative household and firm and consider how the distribution of wealth/income can be expected to affect the preferences of the representative household and how these preferences can be expected to affect the representative firm.
If the representative household is to describe a society that has a high concentration of wealth and, hence, income, it is reasonable to assume that the preferences of the household that typifies that society will favor those kinds of outputs that serve the wealthy few rather than those that serve a mass market and that the representative firm will employ technologies that produce these kinds of outputs most efficiently. By the same token, if the representative household is to describe a society that has a low concentration of wealth/income it is reasonable to assume that the preferences of the representative household will favor those kinds of outputs that serve mass markets and the representative firm will employ technologies that produce these kind of outputs most efficiently.
There is nothing in the standard model that is inconsistent with these assumptions, and, in turn, these assumptions imply, as is argued throughout this eBook, that in a closed economy the use of mass-production technologies will be limited by the distribution of income, and in an open economy the utilization of mass-production technologies will be limited by the country’s current account surplus as well as the distribution of income. For a discussion similar to the above. See: Stiglitz.
[17] The role of borrowing in this situation is explained quit succinctly by Cynamon and Fazzari:
The willingness and ability of the bottom 95% to borrow excessively that kept their demand growing robustly despite their stagnant income growth and sowed the seeds of the Great Recession. Without this borrowing, demand from the bottom 95% cannot come close to attaining the level necessary to reach full employment. Demand from the top 5% has continued to follow the pre-recession trend, but this is not enough. The problem is not so much that output produced by the rising productivity of the middle class is distributed to the upper class, who do not spend it. Rather, the problem is that absent either wage and salary growth or excessive borrowing by the middle class, the spending of the bottom 95% is inadequate to generate the demand growth necessary to push the economy toward full employment at an acceptable pace. A large share of the aggregate income that we could enjoy if our resources were fully utilized is never created at all due to inadequate demand.
It is worth noting, however, that the government's increase in borrowing leading up to the Great Recession had the same effect in increasing demand as borrowing by the bottom 95%.
[18] See the Appendix on Measuring Debt at the end of this chapter for an explanation of the way in which the data from the Historical Statistics of the U.S., Federal Reserve Flow of Funds Accounts, and Bureau of Economic Analysis are used in this figure.
[19] Robert Reich in his Aftershock: The Next Economy and America's Future provides the following quote from Marriner Eccles's Beckoning Frontiers, published in 1950, in which Eccles describes the forces that led to the Great Depression:
As mass production has to be accompanied by mass consumption, mass consumption, in turn, implies a distribution of wealth—not of existing wealth, but of wealth as it is currently produced—to provide men with buying power equal to the amount of goods and services offered by the nation's economic machinery. Instead of achieving that kind of distribution, a giant suction pump had by 1929-30 drawn into a few hands an increasing portion of currently produced wealth. This served them as capital accumulations. But by taking purchasing power out of the hands of mass consumers, the savers denied to themselves the kind of effective demand for their products that would justify a reinvestment of their capital accumulations in new plants. In consequence, as in a poker game where the chips were concentrated in fewer and fewer hands, the other fellows could stay in the game only by borrowing. When their credit ran out, the game stopped.
See also Reich’s excellent documentary on this subject, Inequality For All, that can be viewed on line.
[20] It should be noted that this is only a rough comparison due to the differences in the way current and historical total debt is estimated. See the Appendix on Measuring Debt at the end of this chapter.