![]()
![]()
![]()
![]()
![]()
![]()
The Keynesian World War II Myth
Excerpt from The Theory of Interest (2018)
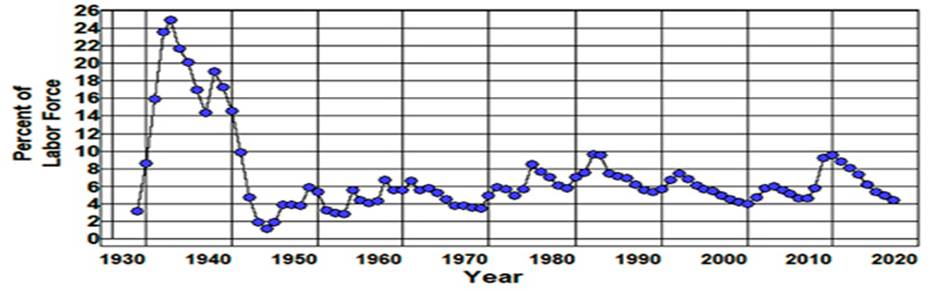
What is particularly disconcerting about the situation we face today is that in spite of the differences between the way in which we survived the recent financial crisis compared to the disaster that followed in the wake of the Crash of 1929 we do not seem to have learned the lessons that should have been learned from the Great Depression, World War II, and the prosperity that followed World War II. Few people seem to realize that, contrary to the conventional wisdom, the United States economy did not recover from the Great Depression. What actually happened was the failure of the private sector to cope with the crisis that began in 1929 led to the New Deal and eventually to a government takeover of the economic system during World War II. There were 8.1 million unemployed in the United States in 1940 and the unemployment rate (Figure 1) did not fall below 14% until 1941.
Figure 1: Unemployment Rate, 1929-2017.
Source: Bureau of Labor Statistics (1), Economic Report of the President, 1966 (D17).
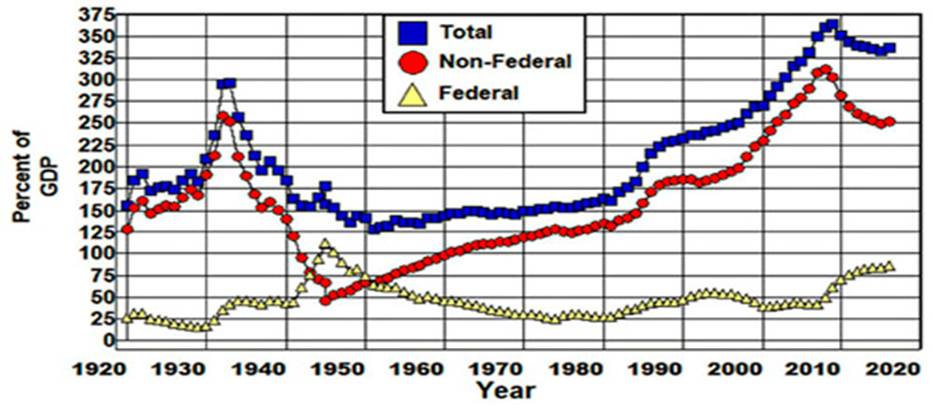
It was not until 1943 that this rate fell below the level in 1929, and by then we were fully mobilized for World War II, and employment in the military had increased by over 8.5 million men and women. And by the end of the war Non-federal debt as a fraction of GDP (Figure 2) had fallen by 50% from what it had been in 1940 as total debt as a percent of GDP was essentially held constant during and following the war.
Figure 2: Total, Non-Federal, and Federal Debt, 1920-2016.
Source: Federal Reserve (L1), Historical Statistics of the U.S.
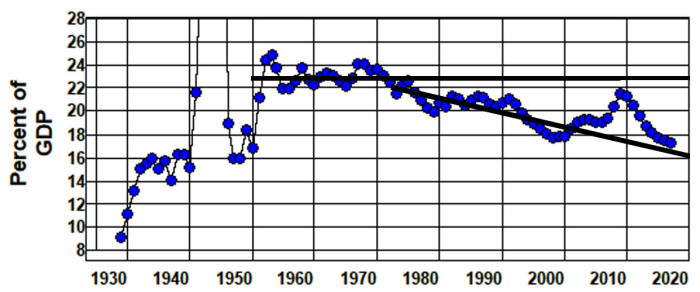
(Cj870, Cj872, Ca10), Bureau of Economic Analysis Table 1.1.5.When we look at what actually happened during this period of history we find that the Great Depression did not end until after the institutional changes of the New Deal were in place, wage and price controls were instituted, the top marginal tax rate was increased to over 90%, consumer goods were rationed, the production of consumer durables ceased, total government expenditures (Figure 3) had risen to 48% of GDP, non-federal debt was reduced dramatically relative to GDP, and the size of the military was increased by more than the number of unemployed in 1940.[1]
Figure 3: Total Government Expenditures, 1929-2016.
Source: Bureau of Economic Analysis, Table 1.1.5 and Table 3.1.
This is what it took to end the Great Depression, and it was the institutional changes that occurred as a result of the New Deal and World War II—the rise of unions, adoption of a minimum wage, progressive taxation, government regulation of financial institutions, the capital controls of the Bretton Woods Agreement, the dramatic reduction of private-sector debt relative to income, and government investment in capital projects as well as in education, social-insurance, and other government programs—that led to the prosperity that followed the war, not an economic recovery as such.
As a result of these institutional changes, the economic system that emerged from the New Deal and World War II was not the system of laissez-faire that led us into the Great Depression. The economic system that emerged from the New Deal and World War II was a system with a substantially reduced nonfederal debt relative to income as a result of the rationing, wage and price controls and the huge government expenditures that had taken place during the war. It was a system in which the capital control provisions of the Bretton Woods Agreement made it possible to keep our international balances (Figure 4) in check and in which financial regulatory institutions made it possible to achieve relatively full employment in the absence of speculative bubbles.
Figure 4: Net Exports, 1929-2016.
Source: Bureau of Economic Analysis, Table 1.1.5.
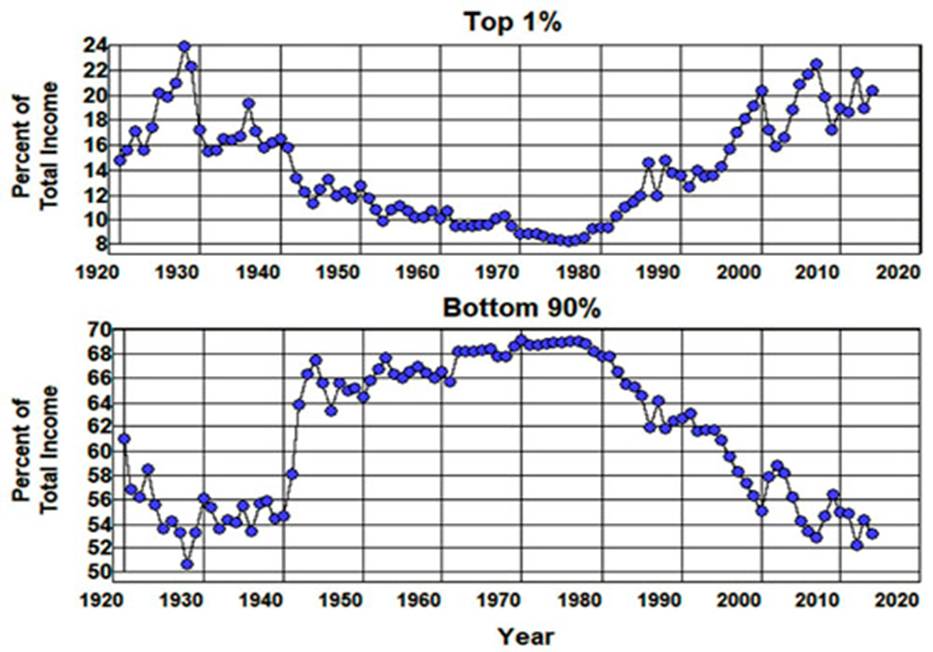
It was also a system in which the progressive tax structure put in place during the war (which remained largely intact for twenty years after the war) combined with the rise of unions, an increasing minimum wage, and the expansion of social insurance made it possible for the income share of the bottom 90% of the income distribution (Figure 5) to increase from 54% of total income in 1933 to 69% by 1973 as the income share of the top 1% fell from 16% to 9% of total income.
Figure 5: Income Share of Top and Bottom of the Income Distribution, 1920-2014.
Source: World Wealth and Income Database.
The result was a dramatic increase in the size of our domestic mass markets which led to an increase in productivity as mass-production technologies and the economic system in general thrived throughout the 1950s and 1960s.[2]
Not only was the economic system that emerged from the New Deal and World War II not the system of laissez-faire that led us into the Great Depression, it was a system that embraced the “somewhat comprehensive socialisation of investment” that Keynes had called for in the final chapter of The General Theory (p. 378) as the government made unprecedented investments in our defense and space programs; paved city streets, country roads, and built the U.S. and interstate highway systems; built and improved water and waste treatment facilities throughout the land along with ports and dams as it electrified vast regions of our country; expanded social-insurance, regulatory, educational, public health, and public safety systems along with many other government programs. As a result of these government investments, the capital stock grew and unemployment remained relatively low in defiance of Keynes’ long-period problem of saving for some twenty-five years following World War II as the government’s contribution to GDP (Figure 6) increased from 9% of GDP in 1929 to 17% by 1950, and to 24% by 1970.
Figure 6: Government Contribution to GDP 1929-2016.
Source: Bureau of Economic Analysis, Table 1.1.5 1.
And there were no speculative bubbles that led to financial crises and government bailouts during this twenty-five-year period as the concentration of income fell with a negligible international balance , and total debt relative to income decreased from 157% of GDP in 1945 to 141% in 1950, and had barely increased to 149% of GDP by 1970 in defiance of the long-period problem of debt.[3]
In other words, it was the economics of Keynes’ long-period problem of saving, not the neoclassical economics of the Keynesians, that was validated by the New Deal, World War II, and the economic prosperity that followed the war. And the economics of Keynes was further validated by the institutional changes that occurred as a result of the policies adopted during and following the 1970s—suppression of unions, failure of the minimum wage to keep pace with inflation, regressive tax policies, financial deregulation, the abandonment of the capital controls of the Bretton Woods Agreement, failure to enforce antitrust laws, and government neglect of capital projects as well as education, social-insurance, and other government programs—that came about in an attempt to reestablish laissez-faire and that led us to where we find ourselves today, faced with the fallout from Keynes’ long-period problem of saving as the contribution of government to GDP fell from 24% of GDP in 1970 to 19% in 2007 and stood at 18% in 2016.
At the same time, the concentration of income rose to levels not seen since the 1920s and trade deficits to levels not seen since the beginning of the nineteenth century, and we became overwhelmed by the long-period problem of debt as total debt relative to income increased from 149% of GDP in 1970 to 349% by 2007 leading up to the Crash of 2008 and was still at 339% of GDP in 2016.
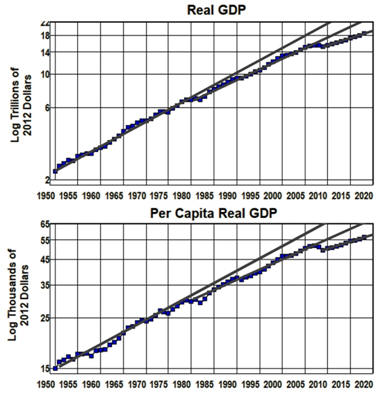
It should not have been a surprise that in the wake of the institutional changes that began in the 1970s total debt rose to the unsustainable levels that led to the Crash of 2008 as the concentration of income increased to levels comparable to those leading up to the Crash of 1929. Nor should it have been a surprise that the system has failed to recover to its prerecession trends (Figure 7) as it adjusts to persistent trade deficits and the increased concentration of income in the absence of speculative bubbles and the failure of debt to increase relative to income.
Figure 7: Trends in Real GDP, 1950-2016.
Source: FRED: GDPC1 and A939RX0Q048SBEA.
These are the kinds of results that should have been expected from the attempt to reverse the institutional changes and “somewhat comprehensive socialisation of investment” that led us out of the Great Depression and into the prosperity that followed World War II. Why should any of this be a surprise? After all, what we are talking about here is an attempt to reestablish laissez-faire, a system plagued by the same long-period problems of saving and debt that not only led to the Crash of 2008 and the economic stagnation that followed, but to the Crash of 1929 and the Great Depression as well—a world-wide depression that led to World War II.[4]
[1] See Blackford (2014a, Chpts. 4 and 6).
[2] See Amy, Bernanke, Blackford (2014a, Chaps. 1-4, 10-12), Boyer and Morais, Domhoff, Eichengreen, Friedman and Schwartz, Kennedy, Kindleberger, Lindert, Meltzer, Perino, Piketty, Polanyi, Shirer, and Zinn.
[3] It is also worth noting that according to Brynjolfsson and McAfee these “three decades proved to be the best ones of the twentieth century” with regard to increases in productivity:
In fact, when you look at history, you see that in the early years of the Great Depression, in the 1930s, productivity didn’t just slow but actually fell for two years in a row—something it never did in the recent slump. Growth pessimists had even more company in the 1930s than they do today, but the following three decades proved to be the best ones of the twentieth century. Go back to figure 7.2 and look most closely at the dashed line charting the years following the dip in productivity in the early 1930s. You’ll see the biggest wave of growth and bounty that the first machine age ever delivered. (p. 106)
[4] See Blackford (2014a, Chaps. 1- 4, 6-8, and 10-12), Eichengreen, Kennedy, Kindleberger, Piketty, Polanyi, and Shirer.