![]()
![]()
![]()
![]()
![]()
![]()
Budget Projections, Federal Debt, Social Security, and Medicare
George H. Blackford © 1/31/2014
The Congressional Budget Office (CBO) publishes an annual report that provides projections of the federal budget under two scenarios: an extended baseline scenario and an extended alternative fiscal scenario. According to the CBO:
The extended baseline scenario generally adheres closely to current law. . . .
Under . . . the extended alternative fiscal scenario, certain policies that are now in place but that are scheduled to change under current law would continue instead, and some provisions of current law that might be difficult to sustain for a long period would be modified. . . . The 2013 Long-Term Budget Outlook.
In effect, the baseline scenario is designed to examine the implications of current law on the federal budget over time, and the alternative fiscal scenario is designed to examine the implications of past and current policies and practices on the federal budget over time.[1]
It is the purpose of this note to show that when we examine our fiscal problems within the framework of the past and current policies and practices embodied in the CBO's alternative fiscal scenario we are driven to two inescapable conclusions.
The first is that unless we increase taxes it is going to be impossible to stabilize the federal debt to GDP ratio and, at the same time, maintain Social Security and Medicare without dramatic cuts in the benefits of these programs in the future.
The second is that even if we do increase taxes it is going to be impossible to stabilize the debt ratio and maintain the benefits of Medicare without controlling the rising cost of healthcare in the private sector of the economy. It is further argued that, ultimately, this means we must find a way to implement some kind of single-payer, universal healthcare system if Medicare is to survive.
The Federal Debt Problem
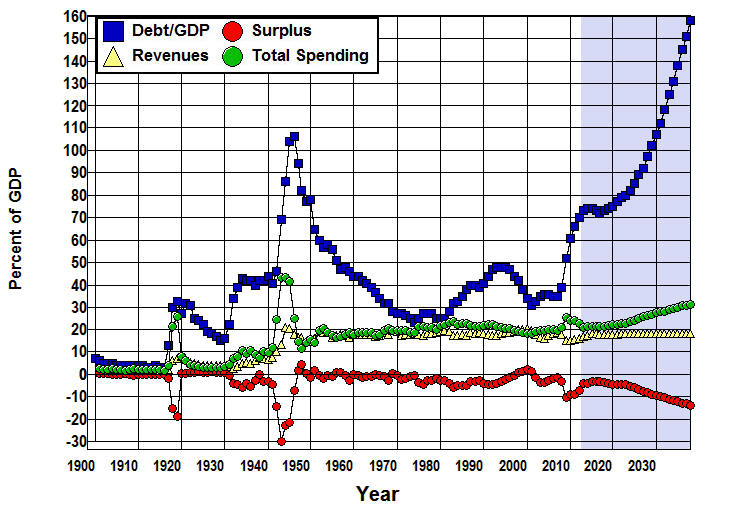
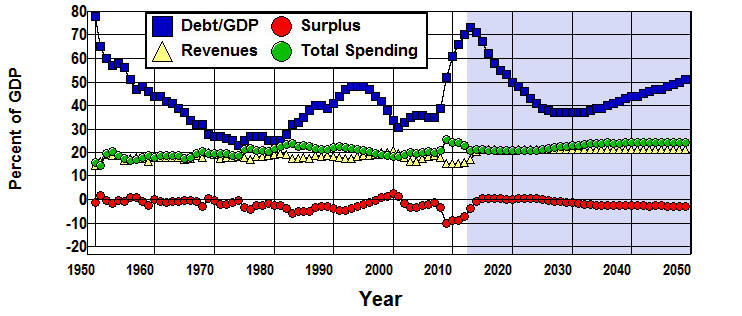
The fundamental nature of the federal debt problem is shown in Figure 1 where the actual levels of federal spending, revenues, and surpluses as a percent of GDP are plotted from 1901 through 2012 and the CBO's 2013 alternative fiscal scenario projections of these ratios are plotted from 2013 through 2038. The table below the graphs summarizes the changes in the CBO's projected values over the projection period.
Figure 1: Government Spending, Revenues, Deficits, and Debt Projections
from the CBO's 2013 Alternative Fiscal Scenario, 1901-2038.
(Percent of GDP) 2013 2038 Difference % Change Debt to GDP Ratio 73% 158% 85.0% 116.4% Revenues 17.0% 18.1% 1.1% 6.5% Total Spending 20.9% 31.7% 10.8% 51.7% Revenues Minus Total Spending -3.9% -13.6% -9.7% 248.7% Net Interest 1.3% 7.5% 6.2% 476.9% Non-Interest Spending 19.6% 24.2% 4.6% 23.5% Source: The 2013 Long-Term Budget Outlook (Supplementary Data),
Office of Management and Budget (Table 1.2).
When we look at the projections in Figure 1 we find that under the policies assumed by the CBO in its alternative fiscal scenario, Revenues are projected to increase only 1.1% of GDP from 2013 through 2038 while Total Spending is projected to increase by 11% of GDP over that same period.
These revenue and expenditure patterns are accompanied by an increase in the deficit (negative surplus) from 3.9% to 13.6% of GDP. These deficits must be financed, and the way they are financed is through borrowing. This, of course, increases the federal debt.
As can be seen in Figure 1, rising debt does not always lead to a problem. When GDP is increasing faster than the debt, as it did for most of 1950 through 1974, the ratio of debt to GDP falls. In this situation, the debt becomes less of a burden as the increase in debt is less than the increase in the tax base (GDP) needed to service the debt. The problem arises when the debt increases faster than GDP, as it is projected to do in Figure 1 from 2017 onward.
A continual increase in debt relative to GDP is unsustainable in that it will eventually lead to a situation in which interest payments overwhelm the budget. This problem is indicated in Figure 1 by the projected 6.2 percentage point increase Net Interest from 2013 through 2038 as the share of Total Spending devoted to Net-Interest increases from 6.2% (0.0622=1.3/20.9) in 2013 to 23.7% (0.2366=7.5/31.7) in 2038.
The Net-Interest component of Total Spending as a percentage of GDP is, of course, derivative in that it cannot be controlled directly. It is ultimately determined by GDP, the size of the debt, and the rate of interest that must be paid on the debt. Since the rate of interest that must be paid is ultimately determined by the willingness of individuals and institutions to lend to the government, the only way the government can affect Net-Interest as a percent of GDP is through it's ability to control the size of the debt and through the effects of government budget policies on GDP.
Examining the effects of government budget policies on GDP is beyond the scope of this note.[2] The discussion below is limited to examining how the structural relationships between non-interest spending and the revenues collected by the federal government can be expected to affect the federal debt to GDP ratio within the CBO's alternative fiscal scenario.
The purpose of this discussion is to clarify the nature of the choices that must be made between increasing taxes and cutting Social Security, Medicare, and the rest of the federal budget if we are to bring the explosive rise in the projected debt to GDP ratio shown in Figure 1 under control.
Cutting Non-Interest Spending to Control the Debt
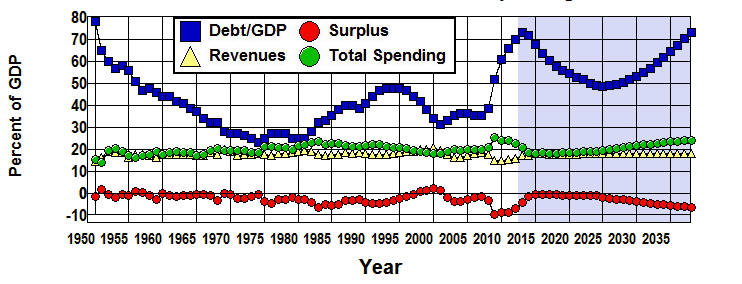
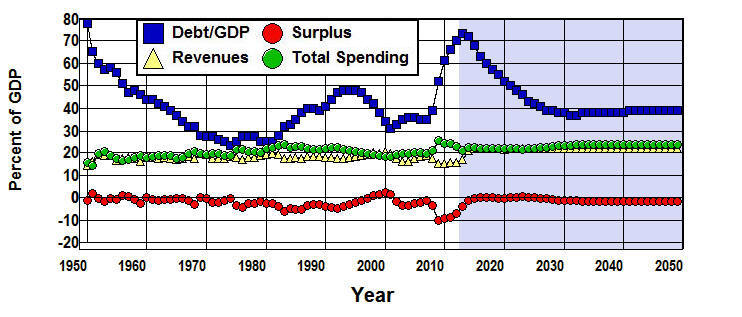
The CBO refers to the amount by which taxes must increase or expenditures must decrease (expressed as a percent of GDP) in order to achieve the current debt ratio at the end of a specific period of time as the "fiscal gap."[3] Figure 2, uses a simple simulation model, based on the data in the Supplementary Data that accompanied CBO's 2013 report, to show how a 15% decrease in non-interest spending in the CBO's alternative fiscal scenario model, beginning in 2014, can close the fiscal gap evident in Figure 1 by 2038.[4]
Figure 2: Reducing Projected Non-Interest Spending by 15%
in the CBO's Alternative Fiscal Scenario.
(Percent of GDP) 2013 2038 Difference % Change Debt/GDP 73.0% 73.0% 0.0% 0.0% Revenues 17.0% 18.1% 1.1% 6.5% Total Spending 20.9% 24.1% 3.2% 15.4% Surplus -3.9% -6.0% -2.1% 54.5% Net Interest 1.3% 3.5% 2.2% 169.9% Non-Interest Spending 19.6% 20.6% 1.0% 5.2% Source: Simulation of CBO model, Office of Management and Budget (Table 3.1).
This 15% decrease in non-interest spending leads to a substantial decrease in the debt ratio in this simulation of the CBO's model, from 73% of GDP in 2013 to 49% in 2025, as federal debt grows more slowly than GDP. Beginning in 2025, this ratio then begins to increase, returning to 73% of GDP by 2038.
With regard to Total Spending, the end result is an increase from 21% to 24% of GDP by 2038, a 3 percentage point increase as opposed to the 11 percentage point increase in Figure 1, while the increase in Revenues remain unchanged at 1% of GDP.
The 8 percentage point drop in projected Total Spending arises from Non-Interest Spending increasing by only 1 percentage point as a result of the 15% cut in Non-Interest Spending rather than by the 4.6 percentage point increase shown in Figure 1. Net-Interest increases by only 2 percentage points rather than by the 6 percentage points shown in Figure 1.
The question is, if we were to take this course in attempting to close the fiscal gap—specifically, cutting spending without increasing taxes—what federal programs would we have to cut in order to achieve this 15% reduction in non-interest spending?
Breaking Down Non-Interest Spending
Figure 3 breaks down Non-Interest Spending into the sum of our three major entitlement programs (Social Security + Medicare + Medicaid) and All Other Non-Interest Spending from 1950 through the twenty-five year projection period shown in Figure 1. This is where the actual cutting in the budget must take place if we are to bring federal debt under control through spending cuts alone.
Figure 3: Non-Interest Spending, Entitlements, and Everything Else,
1950-2038.
(Percent of GDP)
2013
2038
Difference
%Change
Non-Interest Spending
19.6%
24.2%
4.6%
23.5%
Social Security+Medicare+Medicaid
9.6%
14.6%
5.0%
52.1%
All Other Non-Interest, Spending
10.0%
9.6%
-0.4%
-4.0%
Source: The 2013 Long-Term Budget Outlook (Supplementary Data),
Office of Management and Budget (Table 3.1 Table 11.3).
This figure shows the primary reason for the projected increase in non-interest spending in Figure 1, namely, the 5 percentage point projected increase in our major entitlement programs, Social Security, Medicare, and Medicaid. All Other Non-Interest Spending is actually projected to decrease by 0.4% of GDP over the next twenty-five years in the CBO's model.[5]
It should at least be apparent from Figure 3 that stabilizing the federal budget through spending cuts alone would require substantial cuts in our major entitlement programs, Social Security, Medicare, and Medicaid. All Other Non-Interest Spending has already been cut by 3.8% of GDP from 1980 through 2013 and is projected to decrease by an additional 0.4% of GDP by 2038. That amounts to a 30% (0.304=4.2/13.8) cut in All Other Non-Interest Spending relative to the size of our economy since 1980. In order to close the fiscal gap by cutting All Other Non-Interest Spending alone would require an additional 34% (0.344=3.3/9.6) cut in the government programs in this category of the budget.
As I have argued elsewhere, this just isn't going to happen. It will simply be impossible to make the requisite cuts in defense, the Department of Justice, foreign affairs, transportation, science and technology, conservation and pollution control, education, welfare, public health, our regulatory and other public service agencies in the absence of an increase in taxes without substantial cuts in our major entitlement programs.
Eliminating Medicaid
That leaves our three major entitlement programs—Social Security, Medicare, and Medicaid—and it is worth noting that the debt ratio of 73% of GDP in 2038 cannot be achieved in the CBO's model by cutting Medicaid alone. In the absence of an increase in Revenues or a cut in some other portion of the budget, even if Medicaid were completely eliminated the debt ratio would still increase to over 80% of GDP by 2038 in the CBO's alternative fiscal scenario.
Increasing Taxes to Control the Debt
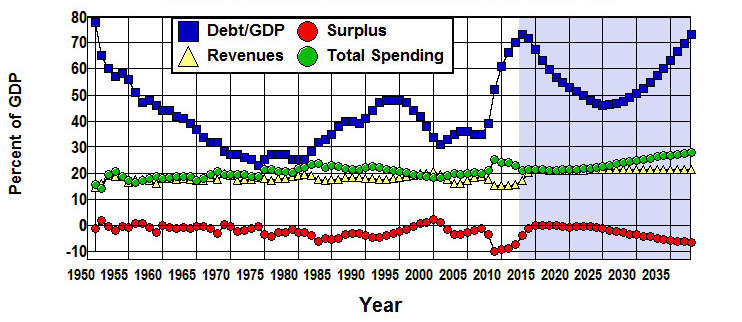
Figure 4 provides a simulation to show how a 17% increase in revenues in the CBO's alternative fiscal scenario, beginning in 2014, can close the fiscal gap by achieving a 73% debt ratio in 2038.
Figure 4: Increasing Revenues by 17% in the CBO's
Alternative Fiscal Scenario.
(Percent of GDP) 2013 2038 Difference % Change Debt/GDP 73.0% 73.0% 0.0% 0.0% Revenues 17.0% 21.2% 4.2% 24.9% Total Spending 20.9% 27.7% 6.8% 32.4% Surplus -3.9% -6.4% -2.5% 65.2% Net Interest 1.3% 3.5% 2.2% 167.3% Non-Interest Spending 19.6% 24.2% 4.6% 23.5% Source: Simulation of CBO model, Office of Management and Budget (Table 3.1).
In this simulation, the 17% increase in Revenues, again, leads to a substantial decrease in the debt ratio from 73% of GDP in 2013 to 48% in 2025 as the federal debt grows more slowly than GDP. Beginning in 2025 this ratio then begins to increase back to 73% of GDP by 2038. At the same time, Non-Interest Spending increase by 4.6 percentage points as in Figure 1.
In comparison with Figure 1 we find that the net effect of this increase in revenue is to decrease the projected level of Total Spending in 2038 from 32% of GDP to 28% of GDP—a 4 percentage point increase in Total Spending as a result of the 17% revenue increase in Figure 4 as apposed to the 11 percentage point increase in Figure 1 without a revenue increase. At the same time, Revenues increase from 17% of GDP to 21% of GDP—a 4 percentage point increase in Revenues in Figure 5 as apposed to the 1 percentage point increase in Figure 1.
The question is, can we afford this kind of tax increase in order to avoid dramatic cuts in Social Security, Medicare, and Medicaid?
Taxes in the Real World
There is a pervasive feeling among the American people that we are terribly overtaxed. In comparison with the other advanced countries of the world, this is not so. The table in Figure 5 shows the percent of GDP paid in total taxes by the thirty-four Organization for Economic Cooperation and Development (OECD) countries in 2010 (the most recent year for which complete set of data is available) ranked from highest to lowest.
Figure 5: Total Taxes in OECD Countries Ranked from Highest to lowest, 2010.
Tax Revenues as a Percent of GDP, 2010
Denmark
47.4%
Germany
36.2%
Canada
30.6%
Sweden
45.4%
Iceland
35.2%
Slovak Republic
28.3%
Belgium
43.5%
United Kingdom
34.9%
Switzerland
28.1%
Italy
43.0%
Estonia
34.0%
Japan
27.6%
France
42.9%
Czech Republic
33.9%
Ireland
27.4%
Norway
42.6%
OECD Average
33.8%
Turkey
26.2%
Finland
42.5%
Spain
32.5%
Australia
25.6%
Austria
42.2%
Israel
32.4%
Korea
25.1%
Netherlands
38.9%
Poland
31.7%
United States
23.8%
Slovenia
38.1%
Greece
31.6%
Chile
19.5%
Hungary
38.0%
Portugal
31.2%
Mexico
18.9%
Luxembourg
37.3%
New Zealand
31.1%
Source: OECD Revenue Statistics - Comparative tables.
The United States ranks third from the bottom on this list. We paid 30% less in taxes in 2010 than the average for the OECD countries, 40% less than the 17 countries that were above the average, 44% less than the top 10 countries, and these are the most advanced and economically productive countries in the world!
Federal revenues were equal to 15.1% of GDP in 2010. If we were to add the 1.9 percentage point increase in federal revenue the CBO projects the federal government will be taking in by 2013 to the 23.8% OECD estimate of our total government revenue (federal, state, plus local) in figure in Figure 5 it would bring our total to 25.7% of GDP. We would then still be fifth from the bottom among the OECD countries (assuming that the numbers for the other countries are unchanged) as listed in Figure 5, just below Turkey, and we would still be paying less in taxes than the average for these countries: 24% less that the average for all, 35% less than the average for the 17 countries that are above the average in Figure 5, and 40% less than the average for the top 10 countries.
And if we were to add the additional 2.9 percentage points required by the 17% federal tax increase needed to achieve the 73% debt ratio in Figure 4 we would still be tenth from the bottom with 28.6% of our GDP in total government revenue, two percentage points below Canada, and we would still be paying less than the average for the OECD countries: 10% less that the average for all, 15% less than the average for the 17 countries that are above the average in Figure 5, and 33% less than the average for the top 10 countries.
It would appear from the table in Figure 5 that the only obstacle to raising the taxes need to avoid dramatic cuts in Social Security, Medicare, Medicaid, or the rest of the federal government is the willingness to do so.
If two thirds of the most advanced countries of the world can afford to pay the kinds of taxes needed to finance our government, why can't we?
The Healthcare Nemesis
Figure 2 shows how a 15% decrease in Non-Interest Spending can yield a 73% debt ratio in 2038 within the CBO's alternative fiscal scenario and Figure 4 shows a similar result for a 17% increase in Revenues, but it is important to note that simply decreasing spending or increasing taxes by these percentages will not solve the long-term federal debt problem posed by the CBO's alternative fiscal scenario summarized in Figure 1. After all, Debt/GDP is increasing from 2025 through 2038 in Figure 2 and Figure 4 even with the assumed decrease in spending or cut in taxes. If the simulations in these figures were extended through 2049 the result would be an increase in the debt ratio to 121% or 115% of GDP depending on whether we increase revenues by 17% or decrease non-interest spending by 15% with the debt to GDP ratio still increasing in 2049.
The reason for the dramatic increase in the debt ratio after 2025 in the CBO's alternative fiscal scenario in spite of the 15% spending cut or 17% tax increase can be seen in Figure 6 which shows the CBO's projections for Social Security, Medicare + Medicaid, and All Other Non-Interest Expenditures through 2088.
Figure 6: Breakdown of Non-Interest Spending Projections, 1950-2088.
(Percent of GDP) 2013 2088 Difference % Change Social Security 4.9% 6.7% 1.8% 36.7% Total Healthcare 4.7% 14.6% 9.9% 210.6% All Other Non-Interest, Spending 10.0% 9.6% -0.4% -4.0% Source: The 2013 Long-Term Budget Outlook (Supplementary Data),
Office of Management and Budget (Table 3.1 Table 11.3).
This figure clearly indicates the extent to which the cost of healthcare dominates projected spending in the CBO's alternative fiscal scenario. In this scenario, the CBO projects that even though Social Security and All Other Non-Interest Spending are expected to stabilize in the 2030s, the CBO's projections have Medicare + Medicaid increasing as a percent of GDP more or less continuously through 2088.
Healthcare costs are projected to increase in this scenario both because as the population ages the baby boomers are in the process of retiring and life expectancy is increasing. These demographic factors are also expected to increase the cost of Social Security (26.5% relative to GDP by 2038), but not nearly as dramatically as the cost of healthcare is projected to increase (78.7% relative to GDP by 2038).
The importance of this discrepancy can be seen in Figure 7 which combines an 17% revenue increase with restrictions on the growth in Medicare and Medicaid spending that keep these programs in line with the rate at which Social Security is projected to increase between 2013 and 2038.
Figure 7: Increasing Revenues by 17 and Keeping Healthcare Increases
Inline with Projected Increases in Social Security, 1950-2049.
(Percent of GDP) 2013 2049 Difference % Change Debt/GDP 73.0% 51.7% -21.3% -29.2% Revenues 17.0% 21.2% 4.2% 24.9% Total Spending 20.9% 24.3% 3.4% 16.4% Surplus -3.9% -3.1% 0.8% -20.7% Social Security 4.9% 6.2% 1.3% 26.5% Medicare 3.0% 3.8% 0.8% 26.5% Medicaid 1.7% 2.2% 0.5% 26.5% Source: Simulation of CBO model, Office of Management and Budget (Table 3.1).
The result is a substantial decrease in the debt ratio by 2038, but this ratio continues to increase after 2033 in the CBO's alternative fiscal scenario even when healthcare costs are brought under control. What it would actually take to stabilize the debt in this simulation of the CBO’s alternative fiscal model is combining the restrictions on the growth in the cost of healthcare in Figure 7 with a 21% increase in Revenues as is shown in Figure 8.
Figure 8: Increasing Revenues by 21% and Keeping
Healthcare Increases Inline with Social Security, 1950-2049.
(Percent of GDP) 2013 2049 Difference % Change Debt/GDP 73.0% 38.9% -34.1% -46.7% Revenues 17.0% 22.0% 5.0% 29.3% Total Spending 20.9% 23.7% 2.8% 13.6% Surplus -3.9% -1.8% 2.1% -54.9% Net Interest 1.3% 2.0% 0.7% 52.8% Source: Simulation of CBO model, Office of Management and Budget (Table 3.1).
This has the effect of stabilizing the debt ratio at around 40% of GDP, and this is what it would actually take to stabilize the budget in the CBO's alternative fiscal scenario—a substantial increase in taxes while keeping healthcare costs inline with the increases in Social Security that are expected to occur as the baby boomers retire.
Conclusion
The CBO's alternative fiscal scenario projections, and those of the simulation model examined above, cannot be taken as a literal prediction or forecast of the future in that they are, at best, rough approximations. In addition, they do not take into account the effects of changes in government spending and tax increases on the overall level of economic activity and the feedback effects these changes have on the budget. Nor do they take into account the kinds of unforeseeable events that can and do take place over any twenty-five or thirty-six year period—events such as wars, natural disasters and financial and other kinds of economic crises—that have dramatic effects on the federal budget.
At the same time, these models and projections provide a broad framework within which to understand our fiscal problems. In attempting to understand these problems within this framework it seems to me that we are driven to two inescapable conclusions.
The first is that it is going to be impossible to maintain Social Security and Medicare without dramatic cuts in the benefits of these programs in the future unless we increase taxes. The only way the debt ratio can be be stabilized if these programs are maintained without an increase in taxes is if there are dramatic cuts in the rest of the budget. As I have noted above, and have argued elsewhere, this just isn't going to happen. It will simply be impossible to make the requisite cuts in defense, the Department of Justice, foreign affairs, transportation, science and technology, conservation and pollution control, education, welfare, public health, our regulatory and other public service agencies in the absence of an increase in taxes without substantial cuts in our major entitlement programs. This means Social Security and Medicare since more than 80% of the money spent on our major entitlement programs is spent on Social Security and Medicare, and less than 20% is spent on Medicaid.
The second inescapable conclusion, as Figure 6 through Figure 8 should make clear, is that it is going to be virtually impossible to maintain the benefits of Medicare if we don't find a way to control the rising cost of healthcare in the private sector of the economy, and, ultimately, this means we must find a way to implement some kind of single-payer, universal healthcare system if Medicare is to survive. This is so because the primary reason federal healthcare costs have risen so dramatically over the past seventy-five years is the anachronistic multiple-payer, third-party, fee-for-service payment system we rely on in the private sector of our economy whereby healthcare providers set the price and tell patients what services they need, and insurance companies pick up the tab. This system virtually guarantees continually increasing costs since the decisions as to what to prescribe and how much to charge are made primarily by healthcare providers—doctors and hospitals—the very people and institutions that benefit the most from increasing healthcare costs. Healthcare consumers play a very limited role in this decision-making process. This archaic, multiple-payer, third-party, fee-for-service payment scheme has caused the American healthcare system to become most expensive and the least efficient among the advanced countries of the world.
Every country that has better health statistics than we do has abandoned the cost ineffective multiple-third-party-payer system for a single-payer, universal healthcare system that provides government subsidized healthcare for all—paid for through taxes—where costs are controlled through government negotiated prices. They pay higher taxes than we do, but their higher taxes are more than offset by the savings in insurance premiums and lower healthcare costs—not to mention the fact that they are healthier than we are, and they live longer than we do. (OECD OECD Charts NYT IOM JAMA1 JAMA2)
Even though the Affordable Care Act promises to improve the health of our population by increasing the availability of healthcare, there is little reason to believe this Act will lead to substantial savings to taxpayers in the absence of a public option. It is either a public option or some other kind of single-payer mechanism that makes it possible for healthcare costs to be controlled in those countries that have better health statistics and lower healthcare costs than we do, and there is little reason to believe we will be able to control our healthcare costs, and, at the same time, maintain the health of our population as we stabilize the federal budget unless we implement a similar system at home.
Finally, I would note that if we were to increase taxes by the 21% needed to stabilize the budget in Figure 8, and if rising healthcare costs were brought in line with the growth of Social Security through the implementation of some kind of single-payer mechanism, it would add an additional 5.6 percentage points our total taxes in Figure 5. This would increase the total government tax receipts in the United States to 29.4% of GDP, but we would not only eliminate our fiscal problems in the process, we would not be forced to cut the benefits of either Social Security, Medicare, or Medicaid in the future.
This may seem to be an exorbitant price to pay for these programs, but government programs are not free, and it is a fantasy to think we can maintain Social Security, Medicare, and Medicaid without collecting the taxes needed to pay for these government programs. If we want to maintain these programs we have to pay the price, and if we were to pay this price while, at the same time, controlling the cost of healthcare by implementing some form of universal, single-payer healthcare system we would still be 10th from the bottom among the most advanced countries in the world in terms of the percent of GDP collected in taxes, just below Canada, and we would still be paying less than the average for these countries: 13% less than the average for all, 26% less than the average for the top 17, and 31% less than the average for the top 10.
Endnotes
[1] Spending was projected to be higher under the alternative fiscal scenario than under the baseline scenario in the CBO's 2013 report because the CBO assumed
. . . that the automatic reductions in spending required by the Budget Control Act for 2014 and later will not occur (although the original caps on discretionary appropriations in that law are assumed to remain in place); that lawmakers will act to prevent Medicare’s payment rates for physicians from declining; that . . . lawmakers will not allow various restraints on the growth of Medicare costs and health insurance subsidies to exert their full effect; and . . . federal spending for programs other than Social Security and the major health care programs will rise to the average of other noninterest spending . . . as a percentage of GDP during the past two decades, rather than fall significantly below that level, as it does in the extended baseline.
By the same token, revenues were projected to be lower under the alternative fiscal scenario than under the baseline scenario because the CBO assumed
. . . that about 75 expiring tax provisions . . . will be extended through 2023; and that after 2023, revenues will remain at 18.1 percent of GDP, matching their 2023 value and a little above the average during the past 40 years of 17.4 percent, rather than rising over time as a percentage of GDP, as they do in the extended baseline. The 2013 Long-Term Budget Outlook.
[2] I have examined the effects of government budget policies on GDP in depth in Where Did All the Money Go? How Lower Taxes, Less Government, and Deregulation Redistribute Income and Create Economic Instability.
[3] From the CBO's 2013 report:
The fiscal gap is a measure of the difference between projected federal noninterest spending and revenues over a given period. It represents the extent to which the government would need to immediately and permanently raise tax revenues or cut spending—or do both, to some degree—to make the government’s debt the same size (relative to gross domestic product) at the end of the period that it is at the end of 2013. The 2013 Long-Term Budget Outlook.
[4] This simulation model is constructed by noting that federal debt at the end of the current year (Di) will be approximately equal to a) the debt at the end of the previous year (Di-1) plus b) the interest paid out during the current year (Ii) plus c) the non-interest expenditures paid out during the current year (NISi) less d) the revenues collected during the year (Ri):
1) Di = Di-1 + Ii + NISi - Ri.
This relationship is not exact in that it does not take into account changes in the cash holdings of the federal government, the accumulation or sale of assets, or the way in which other factors affect cash flows that are not included in the budget, but it can be used to define a model that roughly approximates the effects of changes in the OMB's revenues and spending projections by specifying
2) Ii = riDi-1 + ri(Ri - NISi) / 2
= ri(Di-1 + (Ri - NISi) / 2),
where ri is an approximation to the average rate of interest paid on the federal debt, and the other variables are as defined in equation 1). The significance of 2) is that this equation can be solved for ri,
3) ri = Ii / (Di-1 + (Ri - NISi) / 2),
and, given the values for Di, Ri, Ii and NISi in the Supplementary Data that accompanies the CBO's 2013 report, 3) can be used to estimate the values of ri that are implicit in the CBO's projection models. These estimated values can, in turn, be substituted back into equation 1) to show how changes in non-interest spending and revenues will affect the projected debt/GDP ratio along with net-interest expenditures, total government expenditures, and budget surpluses and deficits.
The nature of the estimates produced by this model is examine in detail in Simulating the CBO's Projection Models where I argue that it is reasonable to assume that these estimates are within five to ten percent of the true values that would be produced by the CBO's model. The Excel spreadsheets that were used to derive the results from this model that are reported in this note can be downloaded by clicking on this link.
[5] It is worth noting that National Defense is the largest single component of All Other Non-Interest Spending in Figure 3 which, according to the Office of Management and Budget, amounted to 41% of All Other Non-Interest Spending in 2013 and is estimated to fall to 32% by 2018. Since the CBO does not give a separate projection for National Defense I have not attempted to deal with this component of the federal budget here, but it is possible separate out defense expenditures in the simulation model used in this note if one wishes to. See: Simulating the CBO's Projection Models.