![]()
![]()
![]()
![]()
![]()
![]()
Chapter 11: Lessons from the Great Depression
Because of the way the current economic crisis came into being, it is unlikely our financial institutions will be able to intermediate between borrowers and lenders to revive the economy anytime soon. The only way they can do this is through a substantial increase in non-federal debt, and it is virtually impossible for financial institutions to increase non-federal debt in the absence of investment opportunities, real or imagined, to justify the increase. (Mian Minsky)
Given our experiences with imaginary investment opportunities over the past thirty-five years, and the disastrous consequences that followed the housing bubble bursting, it is unlikely we will be able to rely on yet another stock-market or real-estate bubble to provide yet another temporary solution to our employment problem. And since the effects of the concentration of income and current account deficits on our domestic mass markets have diminished the real investment opportunities available to us, we are not likely to get out of the hole we have dug ourselves into through yet another substantial increase in non-federal debt. This is especially so given the non-federal debt ratio equal to 278% of GDP that existed at the end of 2013.
At the same time, there is no reason to believe we can revive the economy by purging the system of debt through the conservative monetary and fiscal policies of restraining the Federal Reserve and cutting government budgets. That certainly didn’t work in the 1930s.
Purging Debt in the 1930s
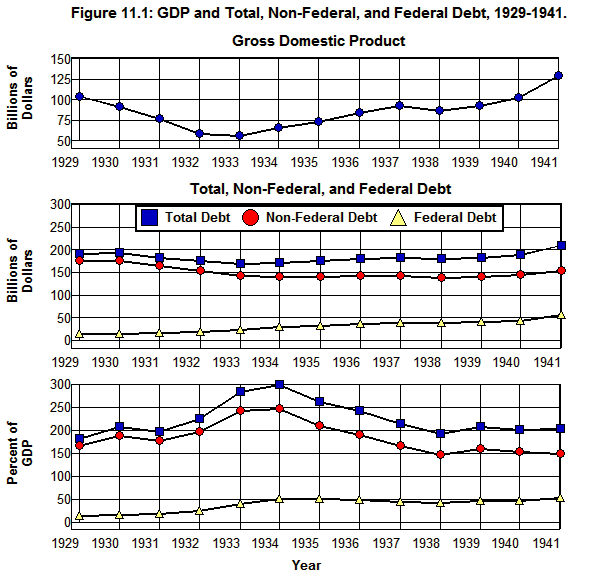
Figure 11.1 shows the relationship between GDP and Debt from 1929 through 1941.
Source: Historical Statistics of the U.S. (Cj872), Bureau of Economic Analysis (1.1.5).
As Non-Federal Debt fell from $175 billion in 1929 to $144 billion in 1933, GDP fell from $105 billion to $57 billion. Thus, in the process of purging $31 billion worth of Non-Federal Debt from the system, GDP fell by $47 billion. The end result was a 18% fall in Non-Federal Debt accompanied by a 45% fall in GDP as the ratio of Non-Federal Debt to GDP went from 168% of GDP to 252% of GDP. And as has been noted, in the meantime, over 10,000 banks and savings institutions failed along with 129,000 other businesses; the unemployment rate soared to 25% of the labor force as 12 million people found themselves unemployed by the time this purging of debt came to an end.
The purging of debt from 1929 through 1933 led us into the depths of the Great Depression, and it is instructive to examine just how we got there.
Monetary Policy, 1929-1933
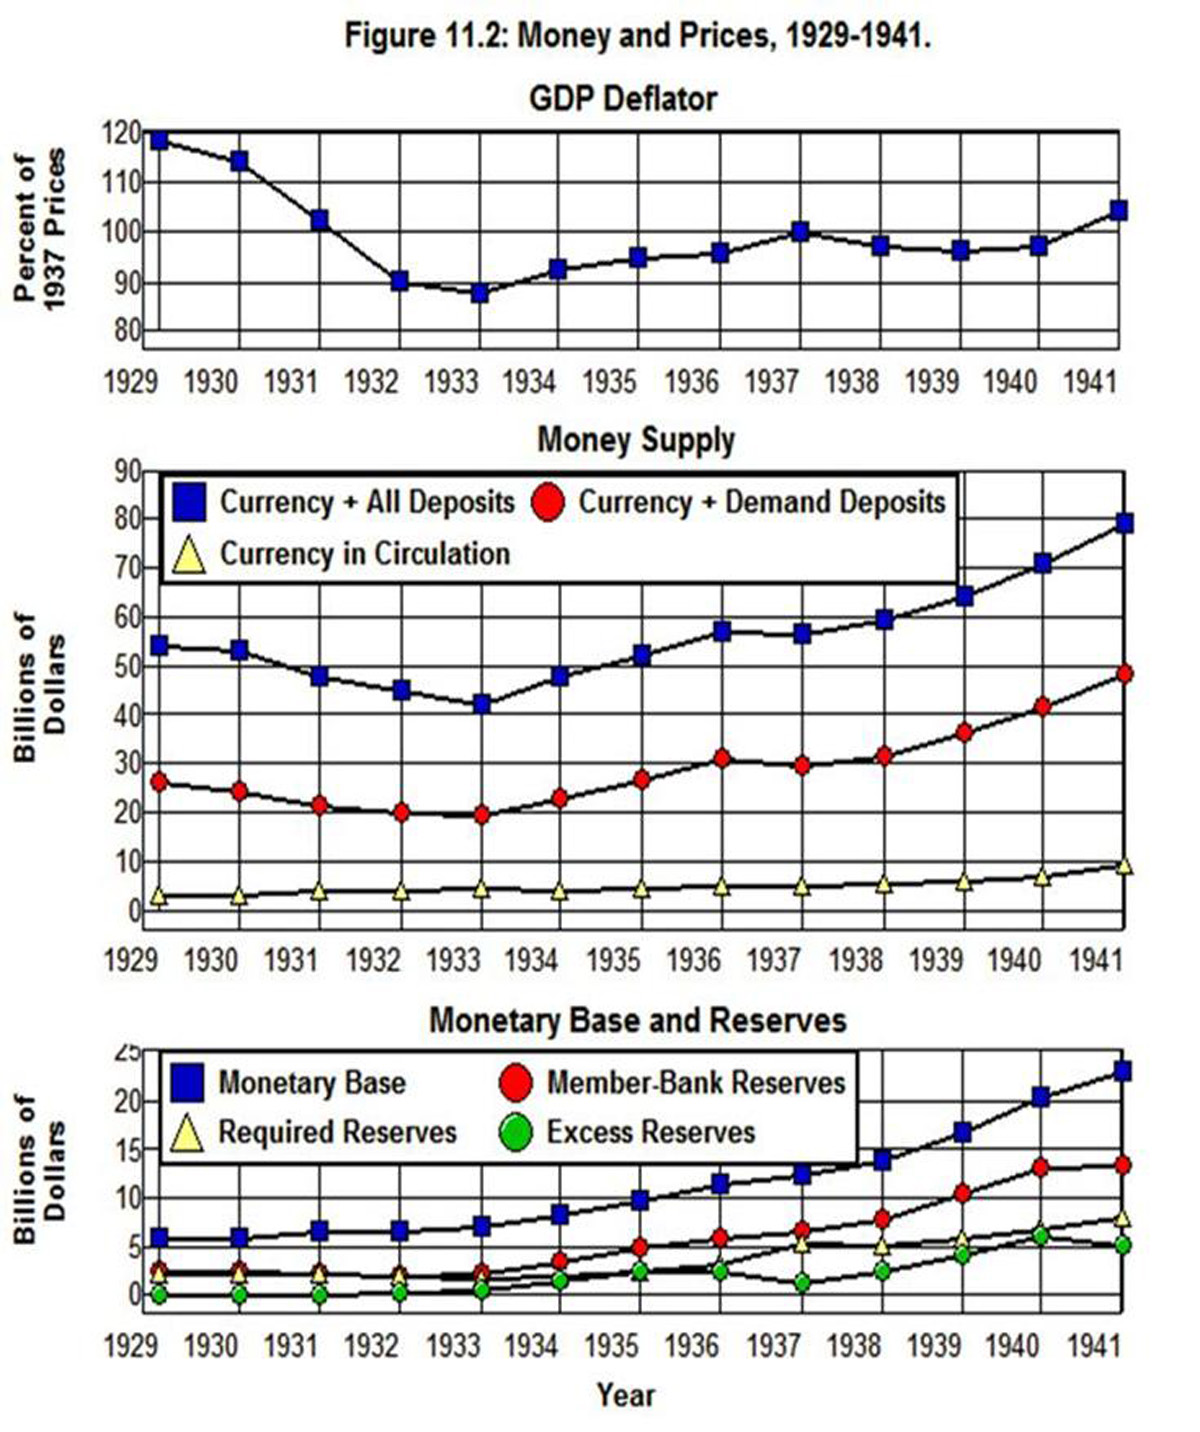
Figure 11.2 shows the implicit GDP Deflator along with the Money Supply and the Monetary Base and Reserves from 1929 through 1941.[54]
Figure 11.2: Money and Prices, 1929-1941.
Source: Bureau of Economic Analysis, (1.1.5 1.1.6A ), Economic Report of the President 1960 (D40 D42).
As is shown in this figure, the demand for currency outside of banks was unchanged in 1929 and 1930 as Currency in Circulation remained at $3.6 billion in both of those years. It then increased by $900 million in 1931 as the banking crisis that began in October of 1930 took hold, and Currency in Circulation increased by an additional $200 million in 1932. By the time the run on the banking system ended in 1933 Currency in Circulation stood at $4.8 billion and had increased by a total of $1.2 billion since 1930.
This 33% increase in demand for currency outside of banks was met by an increase in the Monetary Base that followed a similar pattern as the increase in the demand for currency, but with a lag. The Monetary Base remained unchanged at $6.0 billion in 1929 and 1930, increased by $844 million in 1931, actually fell by $9 million in the midst of the banking crisis in 1932 as Member-Bank Reserves fell by $200 million. The Monetary Base then increased by $329 million and stood at $7.1 billion in 1933.
This lag in the increase in the Monetary Base on the part of the Federal Reserve, combined with the overall timidity of its response to the crisis, allowed Member-Bank Reserves to fall by $265 million from 1930 through 1932. Faced with the economic downturn, the run on the system, falling reserves, and falling asset prices, banks struggled to stay liquid and maintain their solvency by refusing to make new loans or renew existing loans. The result was a fall in the money supply as Currency + All Deposits fell by 22% from 1929 through 1933 (from $54.7 billion to $42.6 billion) while Currency + Demand Deposits fell by 25% (from $26.4 billion to $19.8 billion). (Fisher Friedman Mian)
In turn, the process by which this contraction of the money supply took place had a devastating effect on prices in general as businesses were forced to mark down their inventories and sell them off at a loss. It also had a devastating effect on wages as employers found it impossible to maintain the level of wages they had previously been able to pay as the prices at which they were able to sell the goods and services they produced fell. The deflation that resulted from 1929 through 1933 as the Federal Reserve sat back and allowed the system to purge its debt is shown in Figure 11.2 by the 26% fall in the GDP Deflator from 118.6 in 1929 to 88.0 in 1933.
Fiscal Policy, 1929-1933
Figure 11.3 shows Federal Outlays, Receipts, and Surpluses from 1929 through 1941 along with the Unemployment Rate and the output of goods and services as given by Real GDP measured in 1937 prices.
Figure 11.3: The Federal Budget and Unemployment, 1929-1941.
Source: Bureau of Economic Analysis, (3.2 1.1.6A), Economic Report of the President, 1967 (B20).
As is shown in this figure, federal government expenditures increased by 48% from 1929 through 1931, fell by 26% in 1932, then increased by 17% in 1933. In the meantime, Real GDP (measured in 1937 prices) fell from $88.2 billion to $65.0 billion—a 26.3% decrease in the output of goods and services produced. When this fall in output was combined with the 25.8% fall in prices shown in Figure 11.2 it brought about a 45.3% fall in GDP. As a result, the increase in federal Outlays from $2.8 billion in 1929 to $3.7 billion in 1933 was accompanied by a fall in federal Receipts from $3.7 billion to $2.6 billion, and the budget went from an $800 million Surplus in 1929 to a $1.1 billion deficit (negative Surplus) in 1933.
Thus, while Non-Federal Debt (Figure 11.1) decreased by $31.2 billion during this period, this decrease was partially offset by a $7.8 billion increase in Federal Debt as tax Receipts fell and emergency Outlays increased. At the same time, GDP fell from $104 billion in 1929 to $57 billion in 1933 as the Total Debt ratio went from 183% to 295% of GDP and, as was noted above, the Non-Federal Debt ratio increased from 168% to 252% of GDP.
In the end, a net $23 billion of debt was purged from the system by forcing debtors to liquidate their assets or to default on their debts—a net reduction equal to just 22% of Total Debt. In the process of purging this debt, the Total Debt to GDP ratio—and along with it, the burden of servicing the remaining debt—went through the roof as this ratio increased by 111 percentage points to 283% of GDP and the Non-Federal Debt ratio increase by 84 percentage points to 252% of GDP. At the same time, gross income (i.e., nominal GDP) fell by 45% and output (i.e., Real GDP) by 26%, and it is worth emphasizing again that along the way over 10,000 banks and savings institutions failed along with 129,000 other businesses; the Unemployment Rate soared to 25% of the labor force, and 12 million people found themselves unemployed by the time this purging of debt came to an end.
Deleveraging, 1933-1936
It wasn’t until after the Federal Reserve allowed the Monetary Base to increase dramatically following 1933 in a way that allowed banks to increase their Excess Reserves dramatically—from virtually zero ($60 million) in 1931 to $770 million in 1933 to $1.8 billion in 1934 and to $3.0 billion in 1935—that the purging of debt came to an end. And it wasn’t until after Federal Outlays had increased to 5.1% of GDP and the government’s budget had gone from a Surplus equal to 0.8% of GDP in 1929 to a deficit (negative Surplus) of 3.7% of GDP in 1934 that debt stopped falling and the Unemployment Rate began to fall as GDP began to increase.
In other words, the debt problem that was created in the 1920s was not resolved by forcing debt to be purged from the system through conservative monetary and fiscal policies. These policies, in fact, devastated the economy from 1929 through 1933, and this devastation did not come to an end until:
1. The Federal Reserve expanded the Monetary Base dramatically and provided the Excess Reserves needed by the banking system to end the implosion of the financial system that took place from 1929 through 1933.
2. The federal government increased its Outlays dramatically and, thereby, increased the aggregate demand for goods and services and made it possible for the economic system to grow.
Even then it took the 1933 bank holiday in which all the banks were forced to close and then reopened with a deposit guarantee on the part of the federal government before the carnage caused by the downward spiral of Debt, GDP, and employment was brought to an end.
The 1936-1938 Debacle
Yet another important lesson from the 1930s—a lesson that has particular relevance today—can be drawn from the effects of the change in government policy following 1936 as the federal government attempted to balance its budget by cutting its expenditures and the Federal Reserve attempted to eliminate the excess reserves in the banking system by increasing reserve requirements.
The expansion of government expenditures and the monetary base that began in 1934 led to a 43.1% increase in Output (from $65 billion to $93 billion measured in 1937 prices) and a 42.6% fall in the Unemployment Rate (from 24.9% to 14.3%) by 1937. At that point the expansion came to an end as we returned to the conservative monetary and fiscal policies that had proved so disastrous from 1929 through 1933. In the process we managed to reduce Excess Reserves in the banking system by 68% in 1937 and to nearly balance the federal budget in 1938, but at the cost of a jump in the Unemployment Rate from 14.3% of the labor force in 1937 to 19.0% in 1938 as the output of goods and services (Real GDP) fell by 3.2%, and the Federal Debt to GDP ratio went from 42.2% in 1937 to 46.3% in 1939.
In other words, when the federal government cut its expenditures in 1937 and the Federal Reserve tried to eliminate the excess reserves in the banking system the economic recovery ended and the economy slipped back into a recession. The economic system did not recover from this shock until the federal government and Federal Reserve reversed these policies and government Outlays and Excess Reserves began to increase again after 1938. It is exceedingly difficult to understand just how the benefits gained from this exercise in conservative monetary and fiscal policy, whatever those benefits might have been, justified these costs.
What We Should have Learned
There are at least three fundamental lessons we should have learned from our experiences during the Great Depression.
Conservative Policies Do Not Work
The first lesson we should have learned is that implementing conservative monetary and fiscal policies that purge non-federal debt from the system by forcing debtors to liquidate their assets or default on their financial obligations in the face of an economic downturn is not a good idea. Such policies drove the system into a downward spiral from 1929 through 1933, a downward spiral that did not come to an end until these policies came to an end. The importance of this lesson is reinforced by the fact that when these self-defeating, conservative policies were resumed following 1936, the economic recovery that had begun in 1933 came to an end, and we experienced yet another downward spiral in 1938 that didn’t come to an end until these policies were abandoned for a second time. [55]
It is also worth noting that the deleveraging in the economy that we see in Figure 11.1 as Total Debt ratio fell from 295% of GDP in 1933 to 163% by 1941 resulted from an increase in GDP, not from a decrease in Debt. Total Debt increased from $168 billion in 1933 to $211 billion in 1941 while Non-Federal Debt increased from $144 billion to $155. At the same time GDP went from $57 billion to $129 billion. Clearly, it was the increase in GDP that was facilitated by the expansionary monetary policy and increase in government Outlays that led to the decrease in the debt ratio following 1933, not a fall in Debt brought about by conservative monetary and fiscal policies.
A Timid Response Does Not Work
Another lesson that should have been learned from the 1930s is that a timid response on the part of the government to increase the monetary base and government expenditures in the face of a financial crisis is not enough. This lesson should have been made clear by the fact that the unemployment rate never fell below 14% during the Great Depression and, as we saw in Chapter 3, the unemployment problem was not completely overcome until the federal government began to mobilize for World II. It was only after the conservative monetary policy and budget balancing fiscal policy were completely abandoned and the government began to expand dramatically at the beginning of our involvement in World War II that government expenditures and the monetary base expanded enough to solve the unemployment problem caused by the Great Depression.
The government takeover of the economy during World War II was, of course, far beyond what was actually needed to solve the unemployment problem created by the Great Depression, but our experience during World War II clearly demonstrated that the government did, in fact, have the power to solve this problem through its monetary and fiscal policies. The tragedy was that it wasn't until World War II that the government actually used these tools effectively to solve this problem.
Increasing Taxes Stabilizes the Budget
Finally, one of the most important lessons that should have been learned from the 1930s, and one that has particular relevance today, is that in bringing about the recovery from the downward spiral of income, output, and employment in the 1930s the federal government did not resort to squandering its fiscal resources on worthless tax cuts and transfers to the upper echelons of the society who were able to use the proceeds to purchase the government bonds needed to finance the tax cuts and transfers.
The increases in government expenditures following 1933 were funded, in part, by at least nine tax increases that took place during the Great Depression, starting with the Revenue Act of 1932. In so doing the federal government was able to provide the stimulus effects of its increases in expenditures in a fiscally responsible way as it partially financed these increases by increasing taxes. To the extent these tax increases fell on those who were unwilling to spend, this minimized the negative effect of tax increases on spending while, at the same time, mitigated the effect of the increases in government expenditures on the national debt and, hence, reduced the transfer burden from taxpayers to government bondholders that results from the need to pay interest on the national debt.[56]
As a result, even though the increase in government expenditures in the 1930s was insufficient to bring the economic system back to full employment, because of the tax increases that had taken place the federal debt ratio stood at 42% of GDP in 1937, just as it had in 1933, in spite of the oversize deficits that had occurred over the preceding four years—deficits that managed to facilitate a 43% increase in output along with a 43% fall in the rate of unemployment.
When we look at what happened during World War II we find that the federal debt was not stabilized as federal expenditures rose to over 40% of GDP. But, as we saw in Chapter 3, the tax structure put in place during the war—which, to a large extent, remained in place for twenty years after the war—made it possible to reduce the federal debt to GDP ratio below its 1940 level by 1962. It was the increase in tax rates preceding and during the war that remained in place following the war that made this kind of federal debt stabilization possible.
Endnotes
[54] The Monetary Base is approximated in Figure 11.2 by the sum of Total, Member-bank reserves from the Economic Report of the President 1960 Table D-42 and Currency outside banks from Table D-40.