![]()
![]()
![]()
![]()
![]()
![]()
Chapter 10: The Crash of 2008
While the financial system is generally secure so long as non-federal debt is backed by profitable investments that are self financing or by incomes that are the result of profitable investments, with a non-federal debt equal to 318% of GDP—the point it had reached in 2007 as the financial system began to founder—the transfer of income from debtor to creditor can be problematic. Even a 3% average interest rate would require 9.5% of GDP to be transferred when non-federal debt equals 318% of GDP and a 5% rate would require that 15.9% be transferred. That means an average interest rate of 5% on the $46 trillion non-federal debt that existed in 2007 would require a $2.3 trillion transfer out of a gross income of $14.5 trillion. This kind of transfer from debtors to creditors places a strain on the system even in the best of times, and these were not the best of times.
The problem was, of course, that the non-federal debt created after the dotcom and telecom bubbles collapsed in 2000 was not backed by profitable investments or by incomes that were the result of profitable investments. It was created in the midst of a massive mortgage fraud that led to a situation in which there were $11 trillion worth of mortgages at the heart of the $46 trillion worth of non-federal debt that existed in 2007—mortgages on properties the prices of which had been inflated by the housing bubble that the subprime mortgage fraud had helped to create. As a result, all mortgages were at risk, not just subprime mortgages, and as the fallout from the housing bubble’s bursting spread throughout the financial system the default rate on prime mortgages followed the upward trend of the default rate on subprime mortgages. To make matters worse, the worst of the worst of these mortgages were used to collateralize Mortgage-Backed Securities (MBSs) and sold to hapless investors all over the world. (FCIC WSFC NYU)
The anti-regulation fervor of the times, combined with the freewheeling, cowboy finance this fervor had engendered also led to the unrestricted creation of hundreds of trillions of dollars of over-the-counter derivatives. These derivatives had the effect of turning the financial system into a worldwide casino in that they made it possible for speculators to wager unfathomable amounts of money on the future outcomes of economic events without the benefit of an exchange or clearinghouse to inform or protect the public or to defend the system against the cascading effects of defaults. In the process, speculators not only placed the solvency of themselves and their counterparties at risk, they placed the solvency of the entire financial system at risk. (FCIC)
The lack of regulation in the over-the-counter derivatives markets was particularly acute when it came to the market for Credit Default Swaps (CDSs) which allowed speculators to obtain multiple contracts to insure assets they did not own against default. This meant that the losses caused by a default on an asset that was insured multiple times would be multiplied by the number of times the asset was insured with the complicating factor of the possibility of default on the part of the writers (insurers) of the CDSs that insured the asset.
Federal deposit insurance was sufficient to prevent a run on depository institutions, but this did not prevent a run on the rest of the system. Much of the financial system had been taken over by shadow banks—financial institutions that operated like banks in holding long-term assets financed by short-term liabilities—that were, for the most part, outside the purview of the financial regulatory system with very little restriction on their leverage. Shadow banks were extremely vulnerable to a run when the crisis began since, unlike depository institutions, shadow banks had no insured source of funds or guaranteed lender-of-last-resort protection. And the shadow banking system had become significantly larger than the traditional banking system by the time the financial system began to breakdown. Shadow banks held well over $12 trillion dollars worth of assets in 2007 whereas the total value of all of the assets held by the regulated banking system in that year stood at $10 trillion.
As we saw in Chapters 5 and Chapter 6, financial institutions that hold long-term assets financed by short-term liabilities are particularly vulnerable to financial panics that lead to economic catastrophes because, in the midst of a panic, the short-term funding of these institutions dries up faster than their long-term assets mature. As a result, financial institutions that use this kind of funding without an insured source of funds or guaranteed lender-of-last-resort protection can find themselves in a situation where in order to meet their short-term obligations they are forced to dump their long-term assets on the market. This distress selling of assets can, in turn, causes asset prices throughout the system to fall which threatens the solvency of all institutions that hold similar long-term assets. The resulting fall in asset prices can also make it impossible for some to meet their short-term obligations, particularly when leverage is high, and force them to default on their short-term debts. This, in turn, reinforces the panic
We also saw in Chapters 5 and Chapter 6 how leverage tends to increase during prosperous times in an unregulated financial system. Leverage was, in fact, dangerously high at the beginning of the current crisis, even among those institutions that fell within what was left of our regulatory system. This was primarily a result of three significant changes in the regulatory rules that were promulgated in the early to mid 2000s:
The first was promulgated in 2001 by the OCC, Fed, FDIC, and OTS. It liberalized the rules that allowed depository institutions to set up Special Purpose Vehicles (SPVs) to secure financing in the Asset-backed Commercial Paper (ABCP) and Repurchase Agreement markets. (JPR)
These rule changes were the direct result of the ideological insanity of the times, and the effects of these changes were disastrous. By transferring long-term assets off their books to Special Purpose Vehicles, depository institutions were able to use their SPVs to finance their operations by using the transferred assets as collateral for the Asset-backed Commercial Paper or repurchase agreements issued or undertaken by their SPVs. Since the SPVs were outside the regulatory purview of the government, the SPVs were able to leverage the financing of their assets far beyond what the regulated depository institutions would have been legally able to do if they had kept the assets on their books.
Reducing the capital requirements of those banks that held triple-A rated assets not only led to a situation where 50% of all AAA-rated Asset-Backed Securities remained within the financial system, either held directly on the books of banks or in their off-the-books SPV conduits, it led to a situation where these assets were financed at a much higher leverage than would have otherwise been possible. (FCIC WSFC NYU)
Allowing investment banks to determine their own capital requirements led to a situation in which the five largest investment banks—Bear Stearns, Goldman Sachs, Lehman Brothers, Merrill Lynch, and Morgan Stanley—had leveraged their capital 40 to 1 by 2007, and, as we saw in Chapter 5, this meant that a mere 2.5% fall in the value of their assets would wipe out their entire equity. At the same time, the two GSEs, Fannie Mae and Freddie Mac, had leveraged their capital 75 to 1 meaning that a mere 1.4% fall in the value of their assets would drive them into insolvency. (FCIC) This kind of leverage placed the solvency of the entire financial system at risk when the crisis came as the assets created and held within the financial system began to lose their value.
The fact that:
many of the assets held by banks were held off their books,
the leverage of banks and shadow banks had been allowed to grow beyond any sense of reason, and
there existed over $500 trillion worth of over-the-counter derivatives that had been allowed to come into being in an unregulated market without the protections provided by an exchange or clearinghouse,
created a situation in which no one knew which institutions were at risk or which would survive as the prime rate went from 4.3% in 2004 to 6.2% in 2005 to 8.0% in 2006 and remained at 8% into 2007.
To make matters worse, as was noted in Chapter 4, the resurrection of the failed nineteenth-century ideology of Free-Market Capitalism that led to the deregulation of our financial system was not an exclusively American phenomenon. It had been promulgated all over the world by institutions such as the International Monetary Fund. The result was not only financial deregulation and a housing bubble in the United States but in many countries in Europe and elsewhere around the world. As a result, the crisis that was about to explode in the American financial system in September of 2008 was destined to create a worldwide economic catastrophe.
The Gathering Storm
Subprime mortgages went from 8% of mortgage originations in 2003 to 20% in 2005, and 70% of these mortgages hybrid Adjustable-Rate Mortgages (ARMs) with teaser rates for the first two or three years that would reset to a higher rate thereafter. At the same time, many Alt-A mortgages were issued with little or no documentation and with very high loan to value ratios, often as high as 100%. The profits made on these mortgages came from the fees that were charged for originating them—fees that were added to the principle of the loan—rather than from the interest rates that were charged on these loans. These mortgages were specifically designed to be refinanced and, thereby, to generate more fees since those who received these kinds of mortgages would often be unable to make the larger payments when the interest rates reset if the mortgages were not refinanced. (FCIC WSFC NYU)
Hybrid ARMs with teaser rates were a moneymaking machine for mortgage originators since each time the mortgage was refinanced new fees were generated and added to the principle of the loan. They also seemed to be a safe bet for the mortgage holder as well, so long as housing prices were rising. If the mortgagor was unable to make the payment or refinance the mortgage when the interest rate reset, the mortgage holder would be able to foreclose and take possession of the property in a rising market. And as we saw in Chapter 1, financial institutions managed to accumulate over $700 billion dollars in profits from 2001 through 2007 in excess of what they would have received if there had been no housing bubble.
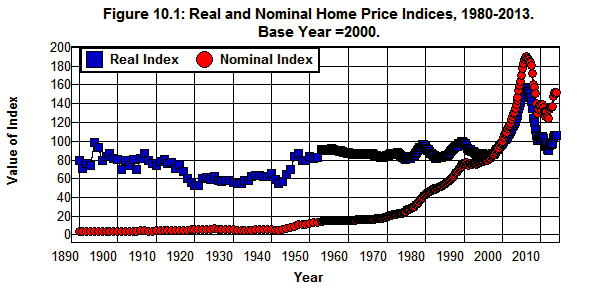
The problem was that in 2006 housing prices stopped rising. Figure 10.1 shows the Case-Shiller home price indices from 1900 through 2013, both in nominal terms and in real terms, that is, after adjusting for inflation. This figure shows the phenomenal increase in home prices that occurred during the housing bubble as the rate of housing price increases accelerated dramatically beginning in 1998. The nominal value of houses more than doubled from 1998 through 2005 as their real value increased by 80%. This figure also shows how this market crashed after its peak in the second quarter of 2006 and prices began to fall.
Source: Case-Shiller Home Price Indices.
As a result, many of those with ARMs were not able to refinance their mortgages or make the payments when the interest rates reset, and delinquencies and defaults on these mortgages rose. The fall in housing prices also meant that when home owners defaulted on their mortgage debts, the mortgage holders would no longer be able to foreclose and take possession of the homes in a rising market and would find themselves holding an increasing inventory of properties that could only be sold at loss.
By the end of 2006 it was apparent that the party was over as hundreds of the smaller independent subprime mortgage lenders had gone out of business along with some that were not so small. (NYU) In commenting on Ownit Mortgage Solutions demise on December 7, 2006 Bloomberg noted that
Ownit joins Ameriquest Mortgage Co., Countrywide Financial Corp., H&R Block Inc.'s Option One, BNC Mortgage Inc. and other lenders in shutting operations or laying off employees as the U.S. housing market slows. Delinquencies are rising, home prices are falling and borrowers of Adjustable-Rate Mortgages are facing higher monthly payments.
When, on April 2, 2007 New Century Financial, the second largest subprime lender in the country, filed for bankruptcy it was clear that the subprime housing market had come to an end. (FCIC) The seriousness of the situation did not begin to sink in, however, until the end of June when two of Bear Stearns's hedge funds began to collapse. When Merrill Lynch seized some $800 million worth of collateral underlying its repurchase agreements with Bear's High-Grade Structured Credit Fund Merrill found that it couldn't sell the CDOs it had seized without taking a loss on its investment. This was, of course, a relatively piddling sum in the grand scheme of things, but the fact that $800 million worth of collateral could not be sold at a price that would cover the cost of the loans made under Merrill's repurchase agreements called into question the viability of the entire market for repurchase agreements.
Then the downgrades began. On July 10, 2007 Moody’s announced a substantial downgrade of 399 subprime Mortgage-Backed Securities and within days Standard & Poor’s followed suit by downgrading an additional 498 securities. (FCIC) This marked the beginning of the run on the shadow banking system that gradually built up steam until it eventually overwhelmed the traditional banking system of the entire world.
On August 9, 2007 the largest French bank, BNP Paribas, was forced to suspend redemptions on three of its SPV conduits to the Asset-backed Commercial Paper (ABCP) market. In response to this news, ABCP markets began to freeze as investors came to realize that these markets were collateralized by assets of questionable value. The lack of government regulation of bank sponsored SPVs made it impossible for investors to know the extent of the problem or which banks were sound and which were not. No one knew which could be trusted, and the inter-bank lending market froze. As a result, central banks all over the world were forced to pump liquidity into the system.
On August 9, 2007 the European Central Bank (ECB) injected 95 billion euros into the Euro Zone (EZ) banking system. On August 10 the Federal Reserve announced it would take the steps necessary to provide liquidity in the financial markets and on August 17 cut its discount rate by 50 basis points as it announced a change in "the Reserve Banks' usual practices to allow the provision of term financing for as long as 30 days, renewable by the borrower." The Fed also broadened the kinds of assets it would accept as collateral for its loans to depository institutions and continued to cut its discount rate and expand liquidity throughout the fall as the hundreds of subprime lenders began to liquidate. On September 14 the Chancellor of the Exchequer announced that the Bank of England would "provide liquidity support for Northern Rock, the United Kingdom’s fifth-largest mortgage lender."
In response to the evaporation of short-term funding for bank-sponsored SPVs, on December 12 the Federal Reserve announced the first of its special lending facilities:
The Federal Reserve Board announces the creation of a Term Auction Facility (TAF) in which fixed amounts of term funds will be auctioned to depository institutions against a wide variety of collateral.
The purpose of this facility was to allow banks to either extend credit to their SPVs or take their SPVs’ assets back onto their books. Had the Fed not done this the assets of bank sponsored SPVs would have been forced on to the market which would have precipitated a dramatic fall in asset prices. At the same time the Fed announced:
The FOMC authorizes temporary reciprocal currency arrangements (swap lines) with the European Central Bank (ECB) and the Swiss National Bank (SNB). The Fed states that it will provide up to $20 billion and $4 billion to the ECB and SNB, respectively, for up to 6 months. (SLFED)
The currency swap lines were arranged to provide liquidity to foreign financial institutions that had borrowed short term in the American money market to finance the purchase of dollar denominated assets. Without this support of foreign institutions by the Federal Reserve those institutions would have been forced, for lack of dollar funding, to dump their dollar denominated assets on to the market. This would have driven the prices of these assets down which, in turn, would have threatened the solvency of American institutions that held the same kinds of assets. (Cecchetti)
These actions provided a temporary reprieve for our major depository institutions, but they did little to assist the investment banks in their attempts to cope with the crisis. As the run on the investment banks and their SPVs continued it eventually reached a climax on March 14, 2008 when the Federal Reserve announced its willingness to support a takeover of Bear Stearns by JP Morgan Chase and on March 24 guaranteed $29 billion of Bear's assets against loss to JP Morgan Chase in order to facilitate the takeover.
Then, on March 16, 2008 the Federal Reserve had announced its Primary Dealer Credit Facility (PDCF) whereby the Fed agreed to "extend credit to primary dealers at the primary credit rate against a broad range of investment grade securities." (FED) Primary Dealers are those institutions that deal directly with the Federal Reserve in implementing its open market policy, and, not coincidently, included all of the major investment banks that were under siege at the time. This was a radical departure from traditional Federal Reserve policy. The Federal Reserve was created to provide liquidity to depository institutions, not investment banks, and, as was noted in Chapter 7, the Fed was only able to create this lending facility under a little known emergency provision, Section 13(3) (12 U.S.C. §343, buried within the Federal Reserve Act. Unfortunately, the change in policy associated with the creation of this facility came too late to save Bear Stearns.
The Federal Reserve continued to lower its discount rate and expand its lending facilities to banks throughout the spring and summer of 2008 in the hope that these stopgap measures would make it possible to avoid an economic catastrophe. Unfortunately, this was not to be. (NYT) The system reached its breaking point in September of 2008 when the federal government was forced to take over Fannie Mae and Freddie Mac on September 7 and allowed Lehman Brothers to file for bankruptcy on September 15.
The Panic Begins
By the time the government took over Fannie Mae and Freddie Mac and allowed Lehman Brothers to file for bankruptcy there were over $600 trillion worth of over-the-counter derivatives outstanding, and no one knew how many of the issuers of these derivative contracts would survive or which would go bust and leave their counterparties holding the bag. Nor did anyone know who would ultimately be on the hook for the inevitable defaults on the non-federal debt outstanding—debt that had grown to $47.2 trillion by 2008 as GDP peaked at $14.7 trillion.
Prior to Lehman Brothers' bankruptcy there was some hope within the financial community that somehow the government would muddle through and save the system. When Lehman Brothers was allowed to fail those hopes were dashed, and a panic ensued that caused financial markets to freeze all over the world. On the day Lehman filed, the Bank of America announced its agreement to purchase Merrill Lynch, and by the end of the week Goldman Sachs and Morgan Stanley, seeing the handwriting on the wall, made arrangements to become bank holding companies thereby subjecting themselves to Federal Reserve supervision. At that point all of the major investment banks had either gone bust, been taken over by a depository institution, or had become a depository institution in the hope that by placing themselves under the protective purview of the Federal Reserve they would be able to survive the carnage.
The day after Lehman filed, the Fed guaranteed an $85 billion loan to American International Group (AIG) to prevent it from defaulting on some $79 billion worth of Credit Default Swaps that AIG had sold without setting aside the capital needed in the event the buyers of these insurance contracts had to be compensated. That same day the Reserve Primary Money Fund "broke the buck" (meaning that value of its assets fell below the value of the money investors had deposited in the fund) due to its losses on Lehman Brothers commercial paper and medium-term notes. This set off a run on the $3 trillion Money Market Mutual Fund (MMMF) industry which is one of the primary purchasers of the commercial paper used by corporations to obtain financing for inventories and to meet payrolls. (NYU) In response, on September 19 the Federal Reserve announced the creation of the Asset-Backed Commercial Paper Money Market Mutual Fund Liquidity Facility (AMLF), and the Treasury announced a program to make available $50 billion to guarantee investments in Money Market Mutual Funds. Both of these moves were designed to keep the run on MMMFs from disrupting the flow of funds to the real sector of the economy. (FRB)
Within five days of Lehman's filing the situation had become desperate. On September 20 the Treasury submitted a proposal to Congress that would authorize the Treasury to purchase $700 billion worth of assets from financial institutions in order to get these assets off their books. The stock markets were thrown into chaos nine days later when Congress rejected this proposal. On October 3, a revised version of the Treasury's proposal was signed into law which authorized the $700 billion the Treasury had requested and created the Troubled Asset Relief Program (TARP) to administer the distribution of these funds. Over the following year and a half some $432 billion of these funds were subsequently used to recapitalize various financial institutions, provide additional funding for AIG, provide foreclosure aid, and to fund the reorganization of General Motors and Chrysler as they worked their way through the bankruptcy court. (FCIC)
On October 7 the Federal Reserve created yet another funding facility, the Commercial Paper Funding Facility (CPFF), in order to further support the commercial paper markets, and on that same day the FDIC increased deposit insurance coverage to $250,000 per depositor in an effort to reduce the run on banks by their large depositors. On the following day the Fed authorized an additional $37.8 billion in support of AIG.
By the end of September the international financial situation had deteriorated to the point of desperation, and on October 11 the Fed removed all limitations on the size of its currency swap lines with foreign central banks in a effort that was coordinated with other central banks to provide unlimited dollar funding for foreign financial institutions:
In order to provide broad access to liquidity and funding to financial institutions, the Bank of England (BoE), the European Central Bank (ECB), the Federal Reserve, the Bank of Japan, and the Swiss National Bank (SNB) are jointly announcing further measures to improve liquidity in short-term U.S. dollar funding markets.
The BoE, ECB, and SNB will conduct tenders of U.S. dollar funding at 7-day, 28-day, and 84-day maturities at fixed interest rates for full allotment. Funds will be provided at a fixed interest rate, set in advance of each operation. Counterparties in these operations will be able to borrow any amount they wish against the appropriate collateral in each jurisdiction. Accordingly, sizes of the reciprocal currency arrangements (swap lines) between the Federal Reserve and the BoE, the ECB, and the SNB will be increased to accommodate whatever quantity of U.S. dollar funding is demanded. The Bank of Japan will be considering the introduction of similar measures.
Central banks will continue to work together and are prepared to take whatever measures are necessary to provide sufficient liquidity in short-term funding markets. (FRS Cecchetti)
Then on October 14 the FDIC increased the protection of FDIC insured institutions "by guaranteeing newly issued senior unsecured debt of banks, thrifts, and certain holding companies, and by providing full coverage of non-interest bearing deposit transaction accounts, regardless of dollar amount" (emphasis added). It is undoubtedly worth noting that this action by the FDIC was taken after all of the major investment banks that had contributed so greatly to the crisis had become affiliated with depository institutions and, thus, fell under the purview of the FDIC.
On October 21 the Federal Reserve announced the creation of the Money Market Investor Funding Facility (MMIFF) to further strengthen the MMMFs to prevent the cutoff of these funds to the real sector of the economy, and on October 28 and October 29 the Federal Reserve established currency swap lines with the Reserve Bank of New Zealand along with the central banks of several Latin American countries.
On November 17 Lincoln National, Hartford Financial Services Group, and Genworth Financial, three large life insurance companies, announced their plans to purchase depository institutions in order to qualify for TARP funding.
And so it went throughout the fall of 2008 and into the winter, spring, and summer of 2009 as the crisis got worse, and it is worth noting that as the crisis got worse, it got worse in a very predictable way:
1. As housing prices fell and delinquencies and defaults on subprime mortgages rose, the lead beneath the gild the financial alchemist had used to obtain triple-A ratings for subprime MBSs and CDOs began to show through, and the value of these securities plummeted.
2. The fact that there were $11 trillion worth of mortgages that had been issued on properties with inflated prices called the value of all MBSs and mortgage related CDOs into question, not just subprime MBSs and CDOs.
3. The fact that an economic downturn was virtually inevitable as the financial markets attempted to sort out the subprime mortgage mess called the value of all ABSs into question whether they were related to mortgages or not.
4. As a result, the short-term financing that both banks and shadow banks were using to finance their holdings of these ABSs began to dry up, and we were faced with a situation in which financial institutions throughout the world were about to be forced to dump literally trillions of dollars worth of ABSs onto the market—ABSs that no one wanted to buy.
5. Given the extraordinarily high level of debt leverage these institutions had been allowed to accumulate, combined with the hundreds of trillions of dollars of over-the-counter derivative contracts related to these ABSs that had been allowed to come into being without the protections of an exchange or clearinghouse, it was clear that if these ABSs were dumped on the market the resulting fall in asset prices and defaults on derivative contracts would have driven an unfathomable number of the world's financial institutions into insolvency and caused a collapse in the financial system throughout the entire world.
6. This, in turn, could be expected to have the same kind of effect on the real economy that it had in the 1930s when the collapse of the financial system throughout the entire world drove the world's economy into the Great Depression.
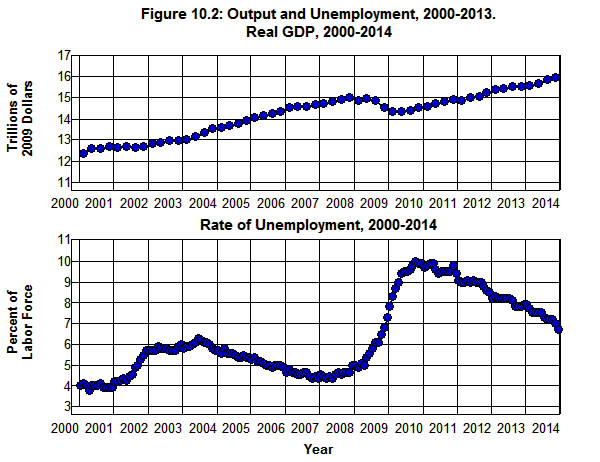
By 2008 the financial sector of the economy was in a shambles, but until the failure of Bear Stearns in March, the financial crisis had relatively little effect on the lives of ordinary people. As can be seen in Figure 10.2, the rate of unemployment had increased gradually from its low of 4.4% of the labor force in March of 2007 to 4.9% by April of 2008 and real GDP had barely decreased.
Source: Bureau of Economic Analysis, Bureau of Labor Statistics
This changed with the failure of Bear on March 14 as the rate of unemployment accelerated, and with the failure of Lehman Brothers on September 15 the downward spiral of financial and real sector feedback began with a vengeance. It didn't come to an end until the third quarter of 2009 as real GDP fell by 4% from the second quarter of 2008 through the second quarter of 2009 and unemployment increased from 4.9% in February of 2008 to 10.0% in October of 2009.
As we saw in Chapter 4, this is the same kind of the problem we faced in the 1930s, but in spite of the fact that the financial situation was much worse in 2008 than it was in 1929, the fallout from the current financial crisis has been much less than the fallout from the crisis that led to the Great Depression where real GDP fell by 30% and the unemployment rate jumped from 3.2% of the labor force to 24.9%.
How We Survived
The fundamental difference between today and the 1930s is that, so far at least, we have been able to minimize the fallout from the financial crisis that began in 2007—the kind of fallout that had such devastating effects on the economy as well as on the lives of so many people in the 1930s. In trying to understand this difference it becomes apparent that the only thing saving us today from the kind of devastation we went through in the 1930s is Big Government. This may seem counterintuitive in today’s world with so much disparaging antigovernment rhetoric out there, but the simple fact is, there are but three threads by which our economic system is hanging as we work our way through the current economic crisis that are keeping us from falling into the abyss we fell into in the 1930s, and those three threads are there only because of the actions and the size of our government.
Federal Reserve Policy
The first thread by which our economic system is hanging is the response to the crisis on the part of the Federal Reserve. By:
1. creating lending facilities that made available hundreds of billions of dollars to financial markets that were frozen,
2. undertaking hundreds of billions of dollars of currency swaps with foreign central banks, and
3. guaranteeing trillions of dollars worth of assets against default,
the Federal Reserve (with the cooperation of the FDIC and Treasury) was able to prevent the disaster that would have taken place if financial institutions, either foreign or domestic, had been forced to dump trillions of dollars of Asset-backed Securities onto the market in a situation in which no one wanted to buy those assets. Through these actions, the Federal Reserve accumulated unprecedented levels of assets on its balance sheet and made available unprecedented levels of reserves to financial systems throughout the entire world.
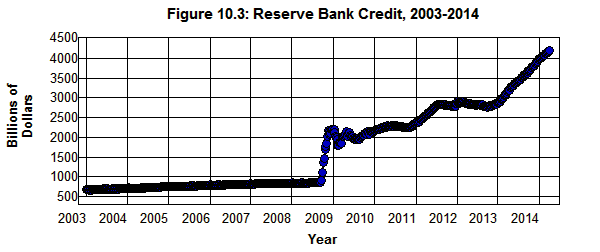
The extraordinary nature of the Federal Reserve’s actions, in this regard, is shown in Figure 10.3.
Source: Federal Reserve Statistical Release.
Even if you do not understand how the financial system works, it should be obvious from looking at Figure 10.3 that something went terribly wrong back in the fall of 2008 and that the actions taken by the Fed at that time were not only unprecedented, they were truly desperate.
The Fed increased Reserve Bank Credit[49] from $842 billion at the beginning of 2008 to $2.2 trillion at the end, and virtually all of that increase took place in the last four months of 2008. Without these actions taken by the Federal Reserve in 2008 our financial system most certainly would have collapsed, and the resulting rate of unemployment most certainly would have been far above the 10% peak reached in 2009. In addition, because the American dollar serves as the single most important reserve currency for international transactions throughout the world, the collapse of our financial system would have brought down the entire international financial system. By providing that credit, the Fed was able to prevent a total collapse of both our domestic and the international financial systems. (Cecchetti) As a result, we have been able to avoid, so far at least, the kinds of consequences suffered in the 1930s from the collapse of these systems as described in Chapter 4, namely, a falling money supply combined with dramatically falling wages and prices that led to the debt-deflation cycle described by Irving Fisher in 1932 and 1933.
The situation was much different in 1929 through 1933. As we will see in Chapter 11, while the Fed did increase its lending to banks and its holdings of government securities by 66% during this period, it took four years rather than four months to do so. What’s worse, because of its ideological faith in the self-correcting nature of free markets, the Federal Reserve actually allowed Reserve Bank Credit to fall by 25% leading up to the banking crisis in 1930. In addition, the Federal Reserve lacked the legal authority to intervene in the economic system in 1933 which Section 13(3) (12 U.S.C. §343) of the Federal Reserve Act gave the Fed in 2008. This authority was not available to the Fed until the Federal Deposit Insurance Corporation Improvement Act (FDICIA) of 1991. (FRS)
To make matters worse, there was no international reserve currency in the 1930s that could be increased to deal with the international financial crisis that developed. There was only gold, and, as a result, the entire international financial system disintegrated as one country after another was forced to abandon that system.[50] All of these factors combined to cause the international financial system to collapse, more than 10,000 banks and savings institutions to go out of business in the United States along with 129,000 other businesses, the money supply to fall by 25%, and the economy to experience a major deflation which exacerbated the fall in output, income, and employment from 1929 through 1933. (Fisher Friedman Kindleberger Meltzer Skidelsky Bernanke) It was the bold and decisive actions of the Federal Reserve that kept these sorts of things from happening during the current crisis.
The Size of Government
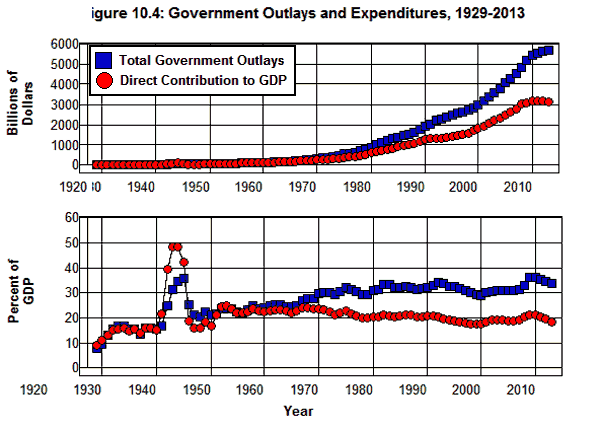
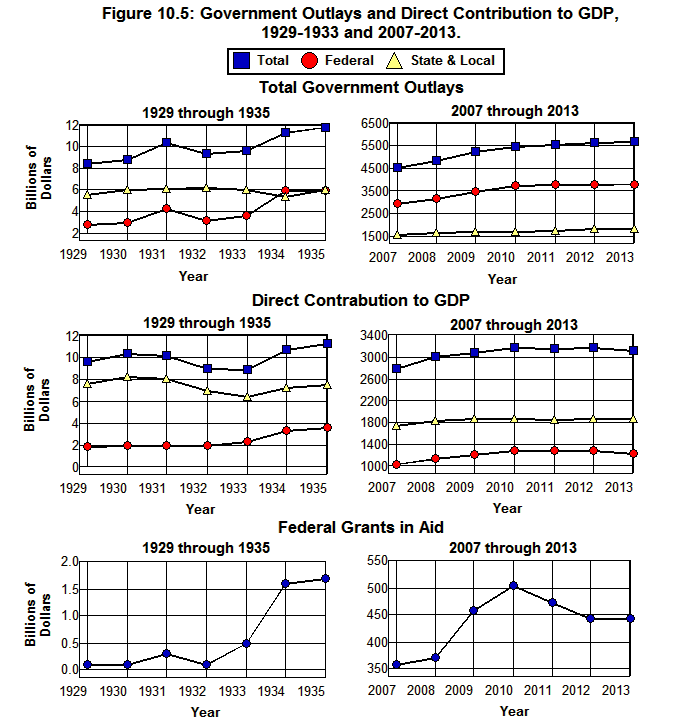
The second thread by which our economic system is hanging that has kept us from falling into the abyss we fell into in the 1930s is the size of government relative to the total economy. Figure 10.4 shows Total Government Outlays from 1929 through 2013 along with government's Direct Contribution to GDP as measured in the National Income and Product Accounts.[51]
Source: Bureau of Economic Analysis (1.1.5 3.1)
Total Government Outlays increased by 22% from 2007 through 2011 during the current crisis going from $4.5 trillion in 2007 to $5.5 trillion in 2011. This increase was the result of 1) spending increases associated with automatic stabilization (i.e., the mechanism whereby government expenditures automatically increase when the economy falters and automatically decrease when the economy booms) caused by the economic downturn, 2) the Economic Stimulus Act passed on February 13, 2008, and 3) the American Recovery and Reinvestment Act passed on February 17, 2009.
These actions helped to save us today because the resulting increases in government expenditures created income for people. This had the effect of short-circuiting the vicious downward spiral of falling income, output, and employment that wrought such havoc during the four years from 1929 through 1933 because the government-created income during the current crisis partially offset the fall in incomes in the private sector of the economy. The stability of government outlays in the face of the economic decline provided a powerful brake on the economy as it spiraled downward during the fall of 2008 and winter of 2009. Without this brake we most certainly would have experienced a much greater level of unemployment than the peak of 10.0% we obtained in October 2009 following the financial system’s grinding to a halt in September 2008.
Again, the situation was much different in 1929 through 1933 where the difference is shown in Figure 10.4 above and Figure 10.5 below.
Source: Bureau of Economic Analysis (1.1.5 3.2 3.3)
In spite of the fact that Total Government Outlays increased by 14% from 1929 through 1933 ($8.4 billion to $9.6 billion) Total Government Outlays were equivalent to only 8% of GDP in 1929 compared to 31% of GDP in 2007. Thus, the government's involvement in the economy was much less in 1929 than it was in 2007, and the government sector was not in as powerful a position to stabilize the economic system in 1929 as it was in 2007. To make matters worse, because of the ideological faith of policy makers in the self-correcting nature of markets, the government's Direct Contribution to GDP portion of Total Government Outlays was actually allowed to fall by 14% from 1930 through 1933 ($10.3 billion to $8.9 billion) after the banking crisis began in 1930. This occurred because even though the federal government's direct contribution to GDP remained fairly constant during this period and actually increased somewhat in 1933, this increase was more than offset by the fall in state and local governments' direct contributions to GDP. It wasn't until federal grants in aid to state and local governments began to increase in 1933 that the fall in state and local governments' direct contribution to GDP came to an end.
During the current crisis, total government expenditures increased by 20% from 2007 through 2010 as federal expenditures increased by 27% and state and local government expenditures by 7%. At the same time, the direct contribution to GDP by the federal government increased by 24%, and due to a 41% increase in federal grants in aid to state and local governments, the direct contribution to GDP by state and local governments increased by 7%. Unfortunately, the ideological opposition to this aid in Washington has led to a cutback in federal aid to state and local governments in recent years and to a concerted effort to reduce the size of government. As we will see in Chapter 11, this does not bode well for the future as it threatens to lead us down the same disastrous path we followed in 1937.
Social-Insurance Programs
The third thread by which our economic system is hanging that has kept us from falling into the abyss we fell into in the 1930s—one that has been essential to keeping us from suffering the kinds of deprivations and hardships that were so widespread in the 1930s—is the fact that a major portion of our federal government’s budget is directly related to social-insurance programs. These programs fall under the headings of Social security and railroad retirement, Federal employees retirement and insurance, Unemployment Assistance, Medical Care, Assistance to students, Housing assistance, Food and nutrition assistance, Public assistance and related programs, and All other payments for individuals in the federal budget in the Office of Management and Budget’s Table 11.3—Outlays for Payments for Individuals. Expenditures in these categories summed to $2.3 trillion in 2010 and comprised 66% of Total federal government outlays.
Not only did these programs provide a major indirect contribution to GDP through the mechanism of automatic stabilization, there can be no doubt that the index of human misery and suffering that exists today as a result of the economic catastrophe brought on by the fraudulent, irresponsible, and reckless behavior of those in charge of our financial institutions and their regulators would have been immeasurably worse had it not been for these $2.3 trillion worth of government social insurance expenditures in 2010 that did not fall during this catastrophe but actually went up. Without the:
$706.7 billion the federal government spent on Social security and railroad retirement,
countless millions of people would not have had these benefits to fall back on, and we would have seen an increase in human misery and suffering as a result of the economic tragedy we have been going through far beyond that which has actually occurred. In 2010 there were some 54 million beneficiaries in the Social Security System alone who would have had to face this tragedy without these benefits if it hadn’t been for the federal government. [52]
There was no Social Security in 1929; no Medicare, Medicaid, military, or veterans’ health benefits; no disability insurance or unemployment compensation; no food and nutrition or housing assistance programs. When the speculators and bankers combined to bring down the system back then people were left on their own to fend as best they could, and the result was suffering and misery far beyond anything we see today. It was because of the immense personal hardship and suffering witnessed during the Great Depression that the federal government was forced to step in, and the Federal Emergency Relief administration (FERA), Civilian Conservation Corps (CCC), Public Works Administration (PWA), and Works Progress Administration (WPA) came into being in the 1930s. And it was because of the immense personal hardship and suffering witnessed during the Great Depression that the social-insurance programs saving us today—unemployment compensation, Social Security, Medicare, Medicaid, and food stamps—came into being. (Kennedy Burns)
Looking Forward
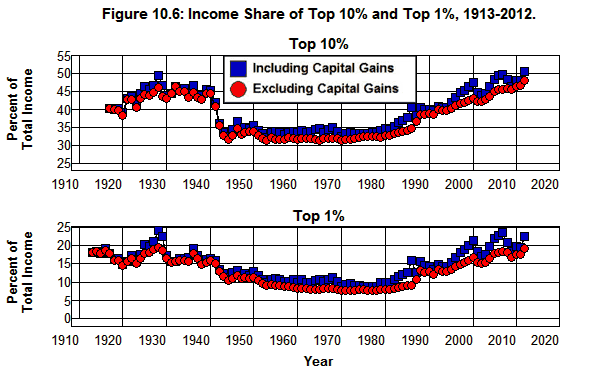
It is important to recognize, however, that none of the measures that have been taken so far to deal with our employment problem have come to grips with the fundamental problem that brought us to where we are today. Even though the fall in output and employment was reversed in 2009 and 2010, our current account deficit had only fallen to $400 billion by the end of 2013, and, as can be seen in Figure 10.6, the concentration of income in 2012 was above that of 2007, at a level comparable to that of 1928, and above where it was as the economy stagnated through the 1930s.
Source: The World Top Incomes Database
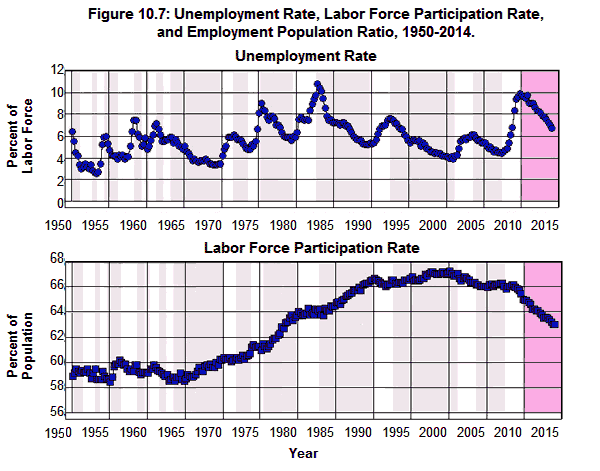
As a result, the economic recovery that began in 2009 is far from satisfactory. The extent to which this is so is illustrated in Figure 10.7 which shows the dramatic increase in the Labor Force Participation Rate that has occurred since the 1960s and how this rate had historically reacted to changes in the Unemployment Rate—decreasing as the Unemployment Rate increased and increasing as the Unemployment Rate decreased.[53] This pattern was broken in 2010.
Source: Bureau of Labor Statistics, (A-1).
As the Unemployment Rate increased from 4.4% of the labor force in 2007 to 10.0% in October 2009 the Labor Force Participation Rate fell from 66.2% to 63.2% of the population, and—unlike economic recoveries in the past—the Labor Force Participation Rate continued to fall from October 2009 through 2013 as the rate of unemployment fell to 6.6% by the beginning of 2014. Most disturbing is the fact that the Labor Force Participation Rate did not fully recover from its fall following the 2001 recession. Undoubtedly, some of the fall in the Labor Force Participation Rate since 2000 can be attributed to the Baby Boomers retiring, but certainly not all. This means that not only were there 3.8 million more people unemployed in 2014 than in 2007, literally millions more who could not find gainful employment, many them young people looking for their first job or displaced older workers who could not find reemployment, were forced out of the labor force as the Labor Force Participation Rate fell from 67.3% of the population in 2000 to 63.2% in 2013.
Endnotes
Reserve Bank credit is the sum of securities held outright, repurchase agreements, term auction credit, other loans, net portfolio holdings of Commercial Paper Funding Facility LLC, net portfolio holdings of Maiden Lane LLC, net portfolio holdings of Maiden Lane II LLC, net portfolio holdings of Maiden Lane III LLC, net portfolio holdings of TALF LLC, total preferred interests in AIA Aurora LLC and ALICO Holdings LLC, float, central bank liquidity swaps, and other Federal Reserve assets. (FRS)
[50] Since my focus is on the current financial crisis, and we are no longer on the gold standard, I have not attempted to explain how the gold standard contributed to the financial problems that led the world into the Great Depression. A summary of the role of gold can be found in Bernanke and a comprehensive discussion of this subject in Eichengreen and Kindleberger. See also the Brief History of the Gold Standard in the United States published by the Congressional Research Service. It is worth noting here, however, that the problems faced today that are created by a unified currency system in the Euro Zone are akin to the problems created by the gold standard’s fixed exchange rate system. See: Stiglitz, O’Brien, and Krugman.
[51] The National Income and Product Accounts measure the direct contribution of various sectors of the economy to the total output produced in the economic system. The contribution of the government sector is measured by excluding transfer payments from the total of government outlays. Transfer payments are expenditures by a government (such as payments to Social Security beneficiaries or for unemployment compensation) that do not correspond to a good or service that is currently being produced or purchased by the government. Only those payments by a government (such as expenditures on education, public transportation, police protection, or national defense) that correspond to a good or service that is currently being produced is included in the National Income and Product Accounts. In 2013, 45% of all government outlays consisted of transfer payments and 55% corresponded to goods or services that were currently being produced.
[52] For a detailed breakdown of the federal budget and a detailed examination of the expenditures on each individual social-insurance program in the federal budget, see Understanding The Federal Budget.
[53] The Unemployment Rate is defined by the BLS as "the number unemployed as a percent of the labor force" where the unemployed are "Persons aged 16 years and older who had no employment during the reference week, were available for work, except for temporary illness, and had made specific efforts to find employment sometime during the 4-week period ending with the reference week. Persons who were waiting to be recalled to a job from which they had been laid off need not have been looking for work to be classified as unemployed." The labor force "includes all [and only] persons classified as employed or unemployed." Thus, someone who wants a job but has given up looking for one is not classified as unemployed in BLS statistics. The Labor Force Participation Rate is defined by the BLS as the "labor force as a percent of the civilian noninstitutional population" where "civilian noninstitutional population" is defined as "persons 16 years of age and older residing in the 50 States and the District of Columbia who are not inmates of institutions (for example, penal and mental facilities, homes for the aged), and who are not on active duty in the Armed Forces."